

Cardlytics (CDLX) - Small Cap FinTech
Cardlytics (CDLX) - Small Cap FinTech
Natural Monopoly with quickly accelerating moat; COVID headwinds largely behind them; LT thesis remains strong

Disclosure: We do own a long position in CDLX. Please read the remaining disclosures at the bottom of this post.
We have had a position since mid-March 2020. We have covered CDLX since early March, with an original intrinsic value estimate of ~$95. Please see the last page in the deep dive titled “Analyst Coverage History” for our full coverage history of the name.
Unique business model with exposure to the Financial Technology (FinTech) theme which adds value throughout the consumer spending value chain (financial institutions, advertisers, and consumers).
Many levers for growth inherent in the business model offer attractive optionality over the long run, with strong underlying secular support driving the advertising, most notably in digital mediums.
Addition of US Bank is on track and underway; last piece of MAU growth for now with management focus turning to monetization and ARPU.
With COVID-19 headwinds largely behind us, we maintain conviction in the long-term thesis for the business, with expectations for robust cash flow generation following the monetization of their existing MAU base.
We’d urge those interested to check out the Yet Another Value Podcast with Cliff Sosin from CAS Partners, Cardlytics largest shareholder. In the episode, they discuss a broad range of topics and then dive into the Cardlytics thesis. We found the podcast extremely helpful in writing this deep dive and in enhancing our understanding of the business. We’d also urge you to follow Andrew Walker, the brain behind Yet Another Value Podcast @AndrewRangely on Twitter. (We have no affiliation with YAVB or Andrew)
You can find the podcast below:
Investment Summary
Company Description
Cardlytics uses purchase intelligence data to make marketing more relevant for consumers and more measurable for marketers. CDLX enters into partnerships with financial institutions (FI’s) in which the FI provides CDLX access to their digital banking platforms and with it, anonymized purchase data. Through the application of advanced analytics and data aggregation, CDLX delivers actionable insights to marketers, helping them to identify, reach and influence likely buyers at scale, while also measuring the direct impact of their marketing spend.
The combination of a plethora of purchase data and direct access to customers using FI’s digital banking infrastructure enables CDLX to solve a fundamental problem for advertisers. In the information age, advertisers have gained access to so much data about their target markets, there’s just one problem: the data is centered around customer behavior and spending within their stores or online platforms. As soon as a customer walks out the door (or logs off), the advertisers lose sight of where the remaining wallet share is being spent. All this without even acknowledging those individuals who are not yet customers, in which advertisers have very little information on (outside of studies which often use proxy information). Through CDLX’s consolidation of largely untapped, high growth mobile and digital banking infrastructure paired with the anonymized purchase data, they team up with advertisers and run highly targeted marketing campaigns, offering consumers an incentive for shopping with a given advertiser.
Value Proposition
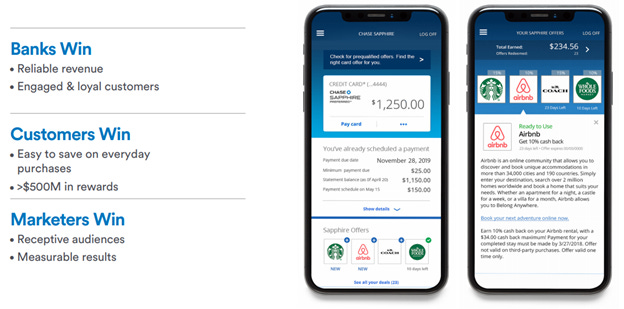
Cardlytics business model offers a unique value proposition to all stakeholders – FI’s with whom they partner with, end market consumers, and marketers seeking to advertise through digital banking channels.
FI’s benefit from reliable, fee-based revenues and increased customer engagement – With FI’s receiving a share from all billings for allowing CDLX access to their purchase data and digital banking channels, the model offers banks an attractive and reliable revenue share based income, helping to diversify away from interest rate pressures faced by many money centers in this environment. FI’s also benefit from increased engagement with their digital banking platforms, a growth engine for many banks as consumers continue to adopt digital and technological solutions for their everyday lives. In the most recent Investor Presentation, CDLX states that banking partners have seen 13% increases in monthly spend following the first customer redemptions of incentive programs, with a 17% increase in logins following the first activation. In short, not only is CDLX driving incremental card spend for the banks, but it also driving online banking engagement.
Consumers benefit from saving on everyday purchases – Through their targeted campaigns, CDLX has offered consumers more than $500M in rewards, per their most recent investor presentation.
Marketers benefit from superior return on ad spend (ROAS) and more targeted analytics – Through their direct marketing strategies and real-time purchase data, CDLX offers a superior ROAS relative to other marketing platforms, with management citing a 4-6x incremental return on ad spend (meaning for every $1 of ad spend, $4-6 of incremental sales are generated). Further, through the real-time nature of purchase data, CDLX can offer better campaign analytics, allowing marketers to be more targeted with their ad budgets and better understand their pain points and hot spots with consumers.
Industry Overview
We now want to assess the total addressable market (TAM) for Cardlytics. For our assessment of TAM, we begin with data from the Bureau of Economic Analysis (BEA), which details personal and household consumption data by product category for the last 20 years. Based on the end markets listed by Cardlytics in their S-1 filing, we estimate the total dollar spend to be ~$4.7T across Motor Vehicles and Parts, Food and Beverage, Clothing and Footwear, Transportation Services, Recreation Services, Food services and accommodations, and other services. According to the most recent Deloitte CMO survey, marketing budgets have increased during the pandemic to their highest levels in the survey’s history, with the survey respondents (274 senior-level marketing executives across a varying array of organizations) averaging a marketing spend of ~11% of revenue. Applying this to our total dollar spend of ~$4.7T, we get an addressable market of ~$515.5B.
Our TAM assessment of ~$515.5B rhymes with management’s assessment as detailed during their appearance at the Needham Virtual Growth Conference on January 13th of 2021 where CEO and co- founder Lynne Laube suggested a TAM of ~$500B based on total ad spend of ~$1T, with CDLX target market (brand level rather than product level marketing) being ~50% of total ad spend, getting to the $500B mark.
Our addressable market has grown ~3% annualized over the last 20 years, with 2020 being an obvious drag on the total period CAGR, with a 10.5% decline in spending in our targeted categories in the year. Without 2020, the 19Y CAGR is closer to 4%, a near 2x premium to global GDP (~2% normalized). In Deloitte’s survey, they saw a meaningful improvement in respondents focus on marketing, with 62.3% of respondents suggesting the marketing function has increased in importance for their business during COVID-19.
With this backdrop in place, we like the underlying industry trends and see a continued shift to digital (mobile/social media) marketing as a tailwind for the industry in aggregate and Cardlytics as the pre-eminent player in the digital banking & digital advertising niche. With COVID headwinds largely behind us, we are confident in the consumer and believe social media and digital marketing will remain the growth driver of the industry on a go-forward basis.
With COVID being an obvious drag on the business, we wanted to spend some time discussing the impacts and where we are today. During the peak of the pandemic, the business saw a wave of marketers leave the channel. As consumer spending dried up because of government mandated lockdowns, marketing spend collapsed and Cardlytics saw revenue declines of 46.4% in the second quarter of the year (trough quarter). It was then that management pivoted into direct-to-consumer (D2C) and e-commerce brands that are less cyclical and more analytical in their marketing approach. This helped to bridge the gap during the pandemic. During their Q4 earnings call, CFO Andy Christiansen noted that the D2C vertical has become their largest vertical and nearly doubled in the fourth quarter, largely driven by the addition of new logos. We believe this speaks to the flexibility of the Cardlytics platform and management’s ability to “land and expand” quickly.
While the D2C pivot has been fruitful so far, we do note that Cardlytics historical verticals (travel, leisure, dining, etc.) are still notably off pre-COVID levels (-20-75% off depending on the vertical). With Cardlytics having already recovered to near pre-COVID billings run rates ($94M in Q420 v. $100M in Q419) with the D2C vertical carrying the team, we see the recovery in their more legacy verticals as additive.
During the fourth quarter earnings call, management provided some anecdotes to speak to the recovery of their legacy verticals throughout the year. During the call, Ms. Laube noted that billings from restaurant partners more than doubled sequentially, with 12 of the top 15 restaurants on the platform being active during the quarter. Even with this recovery in place, the team noted that restaurants and travel are still down ~15% and ~75%, respectively. Our base case is that economies globally continue to recover and, as vaccines continue to rollout, we will see a normalization in spending. This will naturally have some dispersion across verticals and geographies where we see industries like travel and regions like the UK taking a bit longer. Coming out of COVID, we are pleased with managements willingness to pivot and their ability to execute quickly and steer the ship through quite a challenging period for the advertising space and the business at large. As we move through 2021, we believe Cardlytics will be less cyclical and more diversified with exposure by verticals, offering a powerful and durable FCF profile in the out years of the business.
Cardlytics Business Overview
Company Description
Cardlytics uses purchase intelligence data to make marketing more relevant for consumers and more measurable for marketers. CDLX enters into partnerships with financial institutions (FI’s) in which the FI provides CDLX access to their anonymized purchase data and digital banking platforms. Through the application of advanced analytics and data aggregation, CDLX delivers actionable insights to marketers, helping them to identify, reach and influence likely buyers at scale, while also measuring the direct impact of their marketing spend. The company was founded in 2008 by former bankers, Scott Grimes and Lynne Laube and is headquartered in Atlanta, Georgia with satellite offices in New York, California, London and India.
Management
The company is led by CEO and co-founder Lynne Laube. Prior to co-founding Cardlytics, Ms. Laube held various leadership positions within the financial services sector, including stints with Capital One as VP and COO of Capital One Payments. Ms. Laube started her career at Bank One Corporation, where she specialized in operations analysis. She also serves on the Board of Directors for NerdWallet. She holds a BS in Finance and Marketing from the University of Cincinnati’s College of Business and is a graduate of Darden’s Executive Leadership program from the University of Virginia.
Andy Christiansen is the company’s CFO. Prior to joining Cardlytics, Mr. Christiansen held accounting and financial reporting positions at Cbeyond, Inc. Earlier in his career, he held audit and tax consulting positions at PricewaterhouseCoopers and Deloitte. He holds a BS and MAc in accounting from the University of Iowa and is a licensed CPA.
Business Model
Before diving into the company’s growth strategies, strategic objectives, competition, FI partners and marketing verticals, we want to give a quick overview of the unit economics of the business to set the stage for the wide-ranging benefits of all the stakeholders involved, which were detailed at a high level earlier.
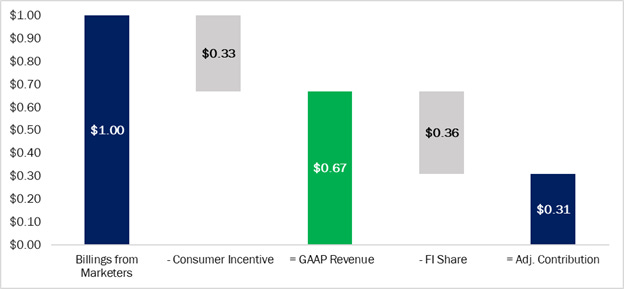
The model begins with gross billings, which are the payments delivered from marketers to Cardlytics for use of the platform. Billings for the Cardlytics platform are priced in two way:
Cost per Served Sale (CPS) – The primary pricing model for the platform where CDLX generates revenue by charging a percentage (the CPS rate) on all purchases from the marketer by consumers 1) who are marketed to and 2) subsequently make a purchase from the marketer during the campaign period, regardless of whether consumer selects the marketing and thereby earning the applicable incentive. The rate is set based on Cardlytics assessment of the marketers ROAS and the incentive paid out to consumers is based on the incremental sales potential of the campaign. CPS contracts accounted for ~70% of total billings per the 2020 10-K.
Cost per Redemption (CPR) – Under the CPR model, marketers specify and fund the consumer incentive and pay Cardlytics a separate, negotiated, fixed marketing fee (CPR fee), for each purchase generated. Cardlytics generates revenue in this model when a consumer 1) is served marketing, 2) selects the marketing and thereby becomes eligible for the consumer incentive and 3) makes a qualifying purchase from the marketer during the campaign period. Again, the pricing of the contracts and applicable fees are based on Cardlytics assessment of the potential ROAS and incremental sales generated by the campaign.
From the initial billings paid for use of the Cardlytics platform, the business pays out its consumer incentives (~33% of billings), by way of returns or discounts for product or service purchases. The number that follows is the company’s GAAP Revenue (Gross Billings less Consumer Incentive). Following the payouts of consumer incentives, the company pays its FI partners a fixed share of revenue (~36% of billings). The waterfall ends with the Adjusted Contribution (GAAP Revenue less FI Share). The below diagram details the unit economics of $1 of gross billings and the drip down to Cardlytics.
This model gives CDLX multiple levers to pull to continue to grow the business going forward (we will expand on the current state and future state of these growth drivers in the “Growth Strategy” section below:
Continued growth in monthly active users (MAU) through content enhancements as well as acquiring new FI partnerships.
Expanding marketing budget wallet share with existing advertisers through increasing platform content offerings as well as penetrating new marketing verticals (growth verticals).
Realizing network effects and operating leverage through the platform with continued investments in infrastructure and personnel to support continued billings growth with limited incremental operating expenses.
Evolving the platform with added touchpoints for consumer and further simplifying the buying process, which will continue to unlock growth through reduced friction driven by continued automation.
Growth Strategy
In this section, we will expand upon each of the points mentioned previously which represents potential levers to pull for incremental growth and scaling the platform further.
Continued growth in monthly active users (MAU)
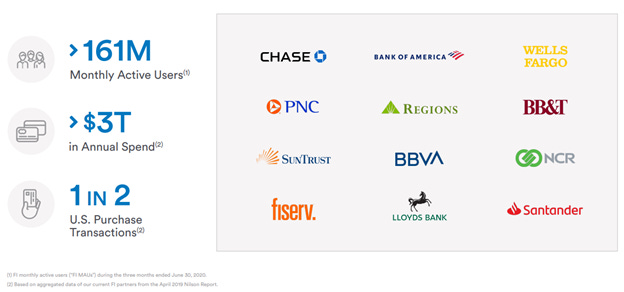
The Cardlytics platform currently has ~163M MAU’s reaching across 7 of the top 10 banks in North America. The company has spent a lot of time in the early years building the relationships with FI partners and scaling the platform, which we feel has granted CDLX a first-mover advantage that will be difficult for new entrants to compete with. With the breadth of FI partners currently on the platform (JPMorgan Chase, Bank of America, Wells Fargo, US Bank coming online in 1H21), Cardlytics has built a significant moat protecting them from new entrants for the time being. Given that marketing is a game of scale, being the platform with 7 of the 10 largest banks in the country builds a unique value proposition for marketers where smaller players will be severely challenged to build a platform with similar reach.
Further, from the perspective of FI’s, the time and investment it took to build this infrastructure makes it very difficult to replicate in-house and comes with switching costs in the case of a new entrant to the marketplace. Since it’s inception, the platform has not had any FI partner voluntarily leave the platform (CDLX did however remove Citi Group from the platform, with management citing poor implementation on the mobile app). Lastly, banks are very conservative and often slow to change or adapt. The fact that some of the largest institutions in the country have signed on with Cardlytics gives us confidence in the company’s ability to provide scale and value that can’t be replicated within a bank alone.
During the Needham Virtual Growth Conference, Ms. Laube mentioned that as the investments in FI partnerships have been developed, the focus of the business is no longer growing MAU’s but now monetizing that MAU base. Per their most recent Investor Presentation, the business currently oversees ~$3T in annual spending, ~1 in every 2 purchase transactions in the United States. This gives the company fertile playing ground to begin tweaking their content offerings and incentive structure, which should provide tailwinds to ARPU in the coming years.
Expanding marketing budget wallet share
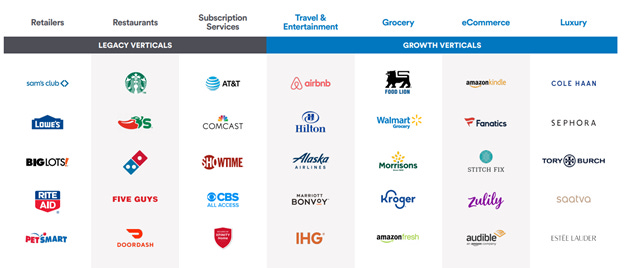
Before the pandemic, the business was focused in more cyclical end markets like restaurants, retail and travel, which ended up posing a very difficult environment for the company during 2020 (billings down 46.4% in 2Q20). Pre-COVID, ~90% of spending was in stores. COVID led a majority of advertisers to immediately halt advertising spend. As a result, CDLX pivoted and began targeting advertisers who were in verticals they were not thinking about or focusing on (direct to consumer (D2C) brands, online-only brands, digital platforms).
As a result of their daily visibility into card spending, they were able to see month-over-month (MoM) recovery in real time, with MoM improvements seen consistently through 2H20. As of January 2021, CDLX has seen almost all advertisers reengage with the channel. While COVID did pose a meaningful challenge for the business, management sees some silver linings: CDLX is now a more diversified ad platform with D2C and online-only additions. These businesses tend to be more technologically advanced and more analytical in nature, which has helped their FI partners get more comfortable as they realize the incremental demand will be additive to the channel. To be clear, this is not a wholesale shift in focus, but an addition to the legacy, more cyclical verticals.
Beyond external marketing budget wallet share gains through new logos, the company has also focused on providing their existing customers with intel and strategy throughout the pandemic. While advertisers were not engaging with Cardlytics, Cardlytics was engaging with the advertisers, offering insight into the daily improvements and progress toward consumer spending normalization. They termed the strategy Rise, Retain, Return and have noted tangible success in those relationships. Per their Q4 earnings call, management noted a broad-based return of advertisers who left during the first half of 2020. Not only are these advertisers reengaging with the platform, but they are expanding their contracts, offering Cardlytics a robust demand pipeline in 2021 and beyond.
Realizing network effects and operating leverage through the platform
As the combination of the previous two levers come to fruition, the addition of FI partners and new marketing verticals will continue to solidify the moat that Cardlytics has built. As we mentioned above, marketing is a game of scale and advertisers do not want to advertise on platforms that are smaller or have less reach. Being that CDLX has insights into ~50% of all transactions in the United States, they offer an extremely attractive channel for marketers which will reinforce the value-add CDLX provides. Further, with the addition of FI’s and new verticals, the incremental amounts of data will help Cardlytics provide incrementally better insights, creating a virtuous cycle of incremental returns on investment (ROI) for the business (and its partners). We have seen this play out in the social media names (FB), search engines (GOOG, GOOGL) and cloud data providers (AMZN – AWS). The network effects inherent in these new business models provide long-term tailwinds as the infrastructure matures. Cardlytics is well-poised for these network effects to go directly to the bottom line as they have spent the early years of their development in building out the platform capabilities and building the FI partnerships which have solidified the moat and make it very difficult to replicate.
Evolving the platform
As the infrastructure and partnerships have already been built, Cardlytics current focus has shifted to monetizing the MAU base. The monetization efforts today are focused on continued optimization of the customer experience: adding more exposure for the incentive offers, enhancing the content on the digital banking platforms and adding more touch points for the consumer. Currently, the incentives are listed as logos on the digital banking app (depiction in the “Value Proposition” section shows the current state). With time, the business wants to add more interactive content (videos, photos of the products etc.) to the platform to offer a more engaging experience for the consumer. Currently, the offers are only displayed on the banking app. With time, the business wants to add touchpoints (read: email) for the consumer to get more access and reduce friction in the adoption and redemption process. The new user interface/experience (UI/UX) will be rolling out in a beta form with US Bank clients (going live in 2021), with the intention being to gauge the incremental engagement with the channel. Cardlytics has also begun the beta testing of a self-service platform (currently in beta at Vayner Media and Horizon Media), which will allow marketing agencies to “self-serve” on behalf of their clients, which will allow for further friction reduction as agencies can run their own campaigns as they get comfortable with the channel. All of these channel enhancements will serve as tailwinds to average revenue per user (ARPU) down the road. Again, we want to reiterate that now that the infrastructure and partnerships have been built, the downward pressure we have seen on ARPU will likely abate and turn to a tailwind as CDLX continues to add value to the platform.

International Growth
Revenue from international markets is ~7.5% of total revenue (per 2020 10-K). Cardlytics is present in the UK today with partnerships with Lloyds and Santander (~50% of UK market on an MAU basis). During the Needham Virtual Growth Conference, Ms. Laube said that the company is thinking about international expansion on a region-by-region basis and thinking about it opportunistically. Perhaps the most interesting prospect in the offshore marketplace is the concept of open banking, a system where API-based connectivity allows greater sharing of financial data. This trend has allowed CDLX to run some beta trials with non-banks in the UK. An example detailed during the growth conference was Cardlytics teaming up with Sainsbury’s, one of the largest grocers in the UK. Sainsbury’s has one of the largest rewards programs in the UK with their grocery rewards business, Nectar. Nectar points allow consumer to earn when they shop at Sainsbury’s, offering free and discounted products as they continue to spend (similar to many other rewards programs throughout the US and the rest of the globe, speaking to the incremental TAM opportunity here if the beta is fruitful).
With open banking dynamics, Cardlytics can treat Sainsbury’s like a bank because they’re able to send customers an email that says “Would you like us to bring you more ways to earn Nectar points, if so, click here”, giving access to transaction data through API’s. From Cardlytics perspective, Nectar now looks like a bank, with the transaction data being the same, the only difference is the offers to consumers, rather than being in currencies, are in the form of Nectar points.
The biggest question here surrounds consumers’ willingness to give access to their transaction data at scale. Throughout the pilot program, the answer has been yes but it remains very early days. If these trends hold, Ms. Laube thinks open banking will be a material growth driver of international markets. Open banking also reduces the time-intensity and regulatory hurdles associated with large financial institutions.
Marketing and Analytics Value-Add
With the basics of the business and their growth drivers and objectives laid out, we wanted to give some more color into how Cardlytics provides value to marketers through their analytics. The Cardlytics value-chain begins with an advertiser’s inquiry or Cardlytics going to an advertiser. From there, CDLX works with the advertiser to address some very basic dynamics: spending by verticals, competitors spending by vertical, location and time of day etc. With this data, Cardlytics can show, with real time data, the ability for the channel to generate incremental sales. To do this, they will create a campaign that has a control group and a test group. The control group will not be targeted or marketed to in any way; the test group will get targeted offers. Cardlytics then gets the results verified by Nielsen, an American information, data and market measurement firm. See the below hypothetical example of how this test campaign would work:
Cardlytics approaches or is approached by Starbucks (SBUX) and details spending dynamics by region, time of day and proximity to competitors. In this example, we’ll use Dunkin Donuts as the key competitor for this campaign. Cardlytics will also detail the spending dynamics of Starbucks customers as well as those of Dunkin Donuts. The goal of the analysis is to find consumers who spend at Starbucks but may opt for Dunkin Donuts at certain times of the day or in certain areas where a Dunkin Donuts is closer.
Cardlytics will work with Starbucks to build a campaign that targets the marginal customers who seem indifferent about where or when they buy their coffee. Cardlytics will have a test group (targeted and marketed group) and a control group (no changes or targeting). They will run the campaign for anywhere from 30-60 days. During the campaign, they will offer the test group an incentive reward (typically 5-15%) at Starbucks (the ad can be for a certain time of the day or can be broad based (spend at Starbucks in the next 30-60 days and receive 5-15% back)).
Following the end of the campaign, Cardlytics will get the results of the tests from Nielsen and will highlight the incremental sales generated through the Cardlytics platform. According to Ms. Laube on the Needham Virtual Growth Conference, Cardlytics is generating incremental ROAS of anywhere from 4-6:1 ($4-6 dollars of incremental sales for every $1 spent on advertising with Cardlytics). This compares to other advertising platforms which offer ROAS ~2:1. It is also worth noting that Cardlytics runs the data with real time purchase data where other platforms use proxy data because they do not have access to raw purchase data. We feel this access to raw data is a unique competitive advantage for Cardlytics and will continue to drive value creation for the business as the platform continues to realize network effects, as we mentioned earlier.
In the future, Cardlytics intends to expand their advertising capabilities to include more dynamic advertising (as we mentioned above, currently it only shows the logos on the digital banking platforms). The business also intends to expand into specific products and SKU’s (5-15% on your cappuccino or iced coffee rather than shopping at Starbucks more broadly).
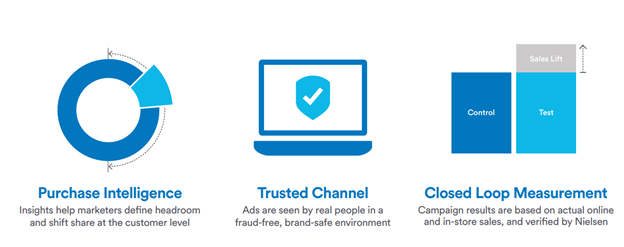
In short, we believe the Cardlytics Direct channel has a number of unique competitive advantages that drive trust and the widening of their moat: 1) purchase intelligence that cannot be replicated without FI partnerships (which come with significant regulatory hurdles and R&D investment). This data offers insights to help marketers define headroom and shift wallet share at the customer level with verifiable results from an independent third party (Nielsen) 2) a trusted channel with ads seen by real people in a fraud-free, brand-safe environment; with purchase data being derived directly from the financial institutions, there is no static from bots or spam accounts, offering marketers a unique, verifiable and trusted channel to advertise through 3) closed loop measurement through their test campaigns where results are based on actual online and in-store sales in real time (example above).
Competition
The advertising industry is highly competitive and fragmented across many styles and end markets. In terms of digital banking enabled advertising, Cardlytics recognizes no direct competition. This is the result of the moat which we have been detailing in this deep dive. It will be extremely challenging for any new entrant to duplicate or compete with the $3.5T of purchase data which Cardlytics currently possesses. While they do have a unique moat, competition for marketing budget wallet share remains a key focus of management. While there are no direct competitors doing what Cardlytics does, they are competing with other rewards programs (likely digital) with a good example being AMEX rewards. On a more macro level, they are also competing with all the other ways businesses advertise to consumers.
Cardlytics wins because consumers, generally speaking, want to be more engaged with their banks as it offers them incentives to save on their everyday purchases; it builds a trust with the bank, forming a mutually beneficial relationship. Beyond that, consumer trends are becoming more digital and technology adoption is rapidly accelerating, with the pandemic providing an incremental tailwind to those trends. From a marketer’s perspective, Cardlytics can see what you can’t. As a marketer today, you have insights into what your customers are doing in your store and on your e-commerce platform, but as soon as they walk out of the store or log out, you lose access to their wallet and spending habits. Even further, besides hypothetical studies using proxies, you have no real intel into how to acquire new customers based on their spending habits, whether that be time of day, location or competitors spending dynamics. This is where the Cardlytics platform is unique and valuable to marketers. With 7 of the 10 largest banks in the country on their channel, Cardlytics offers marketers insights into 1 in every 2 transactions in the country. We believe this moat is sustainable for the medium to long term and offers a meaningful barrier to entry for any new entrants to this space.
Where Cardlytics loses today is their media capabilities. Right now, they are a data company. On the FI partner digital banking platforms, the campaign offers are simply the logo of the business, with no interactive media content or catchy wording to pull the consumer in. Managements focus has been building the partnerships with the banks, building the infrastructure for the Cardlytics Direct platform and building out the MAU base (all of which have been done). As the base is there and quite robust, their focus today is turning to monetizing the existing MAU base (~163M) and driving ARPU through interactive content and the addition of new campaign capabilities (including product/SKU specific campaigns, video advertisements, product photo advertisements, links to websites or menu’s etc.). We believe this was the correct approach for management and appreciate their candid responses to their strengths and weaknesses. Building out the infrastructure necessary to connect Cardlytics to the banks and build rapport with the FI partners, driving MAU growth was the right first step in our opinion.
Business Model & Valuation
Monthly Active Users (MAU) & Average Revenue per User (ARPU)
As we have discussed, Cardlytics management has focused its early years in building out their MAU base and the relationships with their FI partners. It is now when they are shifting their focusing to monetizing the customer base. We want to provide some historical color into the MAU and ARPU dynamics within the platform and how we think things can play out on a go forward basis.
From 2015 through 2020, Cardlytics has grown their MAU base with a ~33% CAGR, from 39M users in 2015 to more than 163M user in 2020. This massive growth was driven by the partnerships with Bank of America, Wells Fargo and JPMorgan Chase. While the addition of US Bank will be additive and will contribute to the network effects in terms of data, management has guided to no meaningful moves in MAU. Even with US Bank being a top 10 bank in the country, given the size and scale of the platform (Cardlytics oversees ~1 in every 2 transactions), it will be difficult to move the MAU scale on a go forward basis.
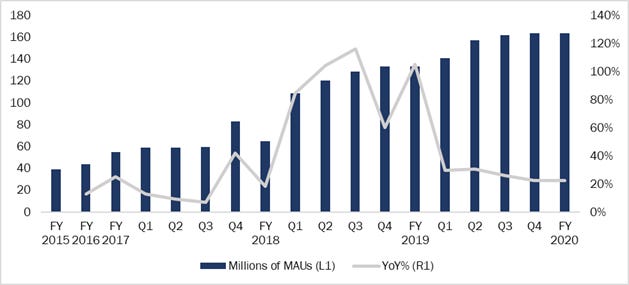
Given the nature of the business, it is typical that MAU growth will precede ARPU and will typically be a headwind to ARPU in the short run. This makes sense when we think about it intuitively: as consumers get onboarded to the platform, it will take time to get comfortable with locating deals and redeeming incentives. As consumers become more comfortable with the platform and as marketers get better insights into consumers, the average revenue per user will expand. We have seen this play out with Cardlytics following the successful launch of Bank of America (BoA) in the early days. In 2015, ARPU was $1.65. Following the ramp BofA clients, we saw significant increases in ARPU to ~$2.23 in 2016 and up to $2.30 in 2018 (as the Chase launch was beginning). In Q119, the Chase launch really took speed with MAU increasing from 65M to ~109M, with MAU reaching 133M by year end 2019. With this came a significant drop in ARPU from $2.30 in 2018 to ~$1.72 in 2019. With the incremental ramp of Wells Fargo and the impacts of COVID-19, it is difficult to get a true sense of the ARPU stabilization in 2020.
Management has guided to a return to 2018 ARPU levels by 2022-2023 with the catalysts being a stabilization in MAU growth paired with the engagement efforts that will drive more revenue per user organically. Engagement efforts include the self-service platform, which we touched on earlier, and the addition of more interactive ad content which is intended to reduce friction and increase redemptions.
Billings, Consumer Incentives, Revenues & FI Share
Billings represent the initial incomes paid from marketers to Cardlytics for use of the Cardlytics Direct platform. In 2020, the company generated ~$263M in gross billings, down 16.7% YoY. From the initial billings, Cardlytics is responsible for the payment of consumer incentives, which represent the savings for the consumer for shopping with the Cardlytics platform. Historically, these incentives have averaged ~33% (through 2020) with a slight trend lower toward ~30% of billings. The company now generates all of its revenues through this platform (see section on unit economics above for a breakdown of how this revenue is generated). In 2020, the company earned ~$186.9M from the platform, down 11.2% from 2019.
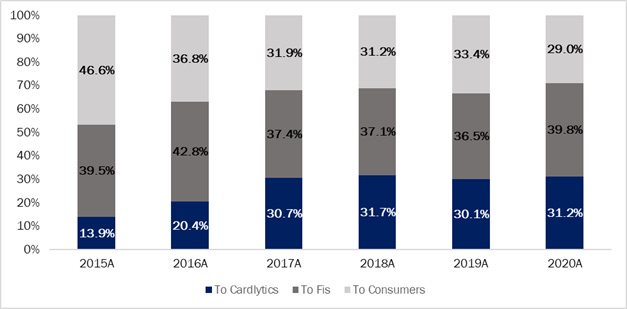
After the company’s GAAP Revenue, they pay a share to their FI partners representing payment for access to the purchase data that enables the whole process. Payments to FI partners have averaged ~35-37% of gross billings, ~55% of revenue.
After their consumer incentives and FI share have been paid, Cardlytics arrives at their Adjusted Contribution, which is essentially their income after the costs of doing business throughout their ecosystem (acquiring purchase data and digital advertising space from FI partners). Their contribution margin has averaged ~45% of revenue and ~31% of billings through the fourth quarter of 2020, with meaningful improvements as the business has reached scale. Cardlytics has seen increasing contribution margins, coming from 38.6% in 2015 to 44.0% in 2020. The below chart displayed these dynamics as a share of total gross billings.
Operating Expenses
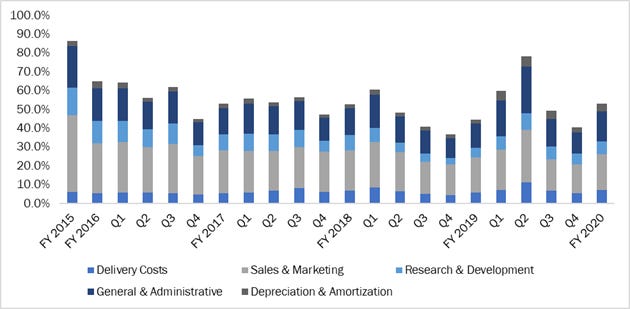
Cardlytics incurs delivery costs which consist primarily of personnel costs for data operations and support teams, hosting facility costs, software costs, outsourcing costs, and professional services costs. With increased growth, there will be increases in the absolute number of dollar spend here, but management does expect delivery costs to decline as a share of revenue going forward.
In addition to delivery costs, Cardlytics incurs standard operating expenses including sales & marketing (S&M), research & development (R&D) and general & administrative (G&A) costs, with a bulk of the remaining operating expenses coming from sales & marketing expenses. As the infrastructure has been built out and matured, R&D expenses have come down a bit from ~14% of revenue in 2015, to ~7% in 2020. Management has continued to reiterate their focus moving to monetizing the existing MAU base rather than a continued buildout of MAU’s (which requires more R&D spending for the platform). We would note, however, that S&M expenses are artificially low coming out of the pandemic. As travel and entertainment (T&E) spend comes back, we would expect a normalization in S&M spending while remaining OPEX line items will likely continue to decrease as a percent of revenue.
In aggregate, Cardlytics has done a great job of finding efficiencies in their business that has allowed for the operating expense line items to continue to decrease as a percent of revenue, speaking to the economies of scale in their business model. During the peak of the pandemic, Cardlytics saw its non-GAAP operating expenses rise from 60% in Q1 to 78% in Q2, speaking to the impact the loss of ad dollars had on the business. It is worth noting that a large part of that spike was driven by stock-based compensation which rose from ~9% of revenue to ~32% in the quarter. As management has continued to see a recovery in consumer spending, they are confident in their ability to reach profitability in 2021, which was set to happen in 2020 with the pandemic serving as a material headwind to that goal.
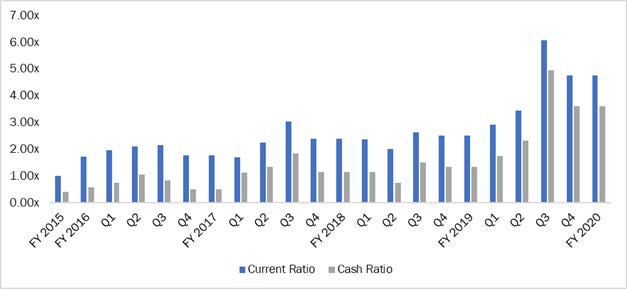
Balance Sheet
Cardlytics has a strong balance sheet with a robust net cash position of ~$119M. Management has focused on creating a strong liquidity position, increasing their cash ratio from 1.2x in 2018 to ~3.6x in 2020. In 3Q20, the company took advantage of open capital markets and record low interest rates, raising $230M in convertible senior notes due in 2025 with an interest rate of ~1%. We see this as an opportunistic move given the interest rate and excess liquidity the market had to offer. This move strengthened the balance sheet significantly as well as gave optionality to go after strategic acquisitions if the company sees fit, which they did in Q4 with the purchase of Dosh.
As the business has approached scale, Cardlytics has flirted with profitability. The pandemic has pushed out the timeline on profitability but the management team is confident in their ability to realize profits in 2021. Prior to the pandemic, 2020 was set to be the year the business reached profitability. With worldwide lockdowns and a near stop to consumer spending, marketing activity dried up and the business suffered throughout the year, seeing returns on capital drop from near-breakeven to deeply negative throughout the year. Given recent color from management on earnings calls and other conferences, we are optimistic that consumer spend and with it, marketing spend will come back strong in 2021. The consumer has seen savings rates rise materially from pre-pandemic levels; the results of record levels of fiscal and monetary stimulus and artificial lockdowns have created a pent-up demand we haven’t seen in some time. As the vaccine continues to roll out, we are confident in the business’ ability to reach profitability in 2021.

As the business has continued to scale, they have seen a stabilization in incremental margins. Incremental margins can be thought of as the drip down of an incremental dollar of revenue. Looking at both incremental adjusted contribution and gross margins, we have seen a more normalized profile following the addition of JPMorgan Chase in 1H19. Following the increase in user growth from ~18% in 2018 to 105.2% in 2019, incremental margins have stabilized in the arena of ~50%. Note that the difference between Adjusted Contribution and GAAP Gross Profit is the additional expenses relating to delivery costs and other non-cash expense relating to the amortization of deferred implementation costs. In short, now that the business has scaled their user base and is shifting focus to monetization, we expect 1 incremental dollar of revenue will be ~50 cents to Cardlytics gross profits.

The strong incremental margin profile is paired with strong economies of scale at the operating level. With customer acquisition costs relatively low (we estimate ~$0.30-0.40 at scale) and ARPU ~$1.14 on a trough top line (2020), we see a strong case for robust operating income growth and margin expansion in the next 3-5 years. The business model and the strong investments in their early stages have set up the team to see robust growth in returns on capital. For 2021, we do see Cardlytics reaching sustained positive ROC territory and think the company is well-positioned continue to grow returns on capital over the long run.
Model Assumptions and Valuation
Revenue & Adjusted Contribution Margin
We model CDLX revenue by first estimating a run rate on Gross Billings. Through 2019, Cardlytics outperformed their TAM by ~10x (~30% Billings CAGR vs. ~3.5% TAM CAGR); including 2020, Cardlytics has outperformed by ~5x. As a reminder, TAM is ~$500B while Cardlytics 2020 Billings were ~$263M. With that said, the market opportunity is sizeable and our estimates should be taken with a grain of salt, considering the growth of the business and the opportunity to capture market share. With that said, we will elaborate on our methodology below.
With our base case being a resurgence in consumer spending that is initially driven by excess liquidity and pent-up demand, we think Cardlytics can continue to outperform their TAM and continue to gain market share. On an ongoing basis, we believe the adoption of digital banking and broader adoption of mobile and digital technology will continue to fuel superior growth for Cardlytics relative to the broader advertising industry. We believe that their analytics platform is unmatched and the barriers to enter for a new competitor will be steep and would bring on significant switching costs for the FI partners, making a wholesale change unlikely in our opinion. With this said, as new MAU’s come to the platform, the data analytics will fuel better insights and will allow Cardlytics better pricing power because of the incremental value added.
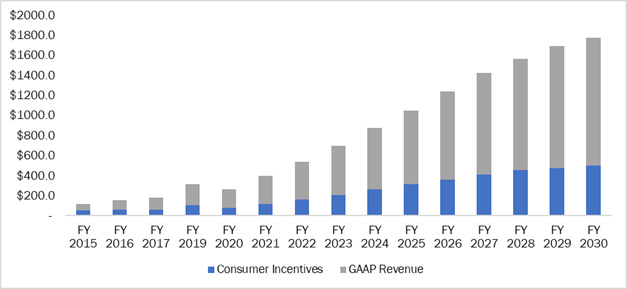
With this base case in mind, we have Cardlytics billings growth outperforming that of TAM (which we assume historical CAGR of 3.6% through 2030) to outperform ~9x, with a CAGR of 31.8% through 2025. We then have the second phase of growth, where Cardlytics outperforms TAM by ~3x with a 2025-2030E CAGR of 11.1%. This second phase represents a maturation and penetration of the Cardlytics platform, with growth slowing and 2030 billings topping out at ~$1.8B, representing a 10Y CAGR over the whole model of ~21.0%, ~6x that of the TAM.
With regards to our haircut to billings (consumer incentives), we don’t expect a material change in the percent of billings that gets paid to consumers. On the margin, we do include some downward revisions to the consumer incentives expenses as a percent of billings representing the additional value Cardlytics will be able to provide to FI partners and advertisers, which should bring on marginal pricing power. In the model, we have consumer incentives as a percent of billings at ~30% in 2020 and getting to ~28% in 2030, with the benefits coming in the mature phase of the model (post-2025). A reminder, billings less consumer incentives get us to our GAAP revenue estimates, which implies a 10YE revenue CAGR of 21.2%, with the ~20bps benefit coming from the marginal reductions in consumer incentives.
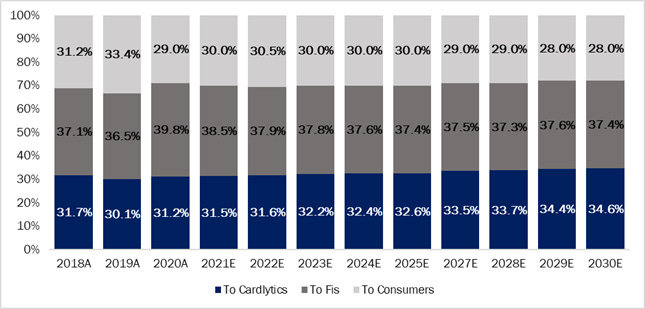
To get to adjusted contribution, we have to take into account the cost of the financial services platforms and data. Similar to consumer incentive, we do expect marginal benefits to Cardlytics with regards to the cost of FI partnerships, partly due to the benefits the banks will receive from increased consumer engagement which may drive wallet share. Further, FI partners will be hard pressed to find a substitute to Cardlytics that can offer the same scale, making switching costs high. We believe this puts Cardlytics in a strong competitive position and will allow them marginal benefits on their adjusted contribution margin. Throughout the model, we have FI share moving from 56% in 2020 to ~52% by 2030. The slight decreases in consumer incentive and FI share are the drivers behind our contribution margin expansion, which we have expanding from 44% in 2020 to ~48% by 2030.
Operating expenses and margins
With marginal improvements on the gross side of the business (adjusted contribution/gross profit), we believe operating efficiencies will be the driver of profitability for the business over the second phase of our growth cycle. As the Cardlytics platform reaches scale, network effects should drive operating margins for the business. Currently overseeing ~1 in every 2 transactions, the platform offers an unmatched value proposition for marketers, which should allow for more organic wallet share (less S&M spending). Further, management has been transparent about the R&D spending required for the platform; now that the focus has shifted focus to monetizing the user base, we think it will yield more of a maintenance style R&D approach rather than growth R&D spending.
For estimating our operating expenses, we look at non-GAAP (breaking out stock compensation from true operating spending). As the business is young, there has been a fair amount of volatility in SBC spending (largely driven by performance hurdles being cleared) which has made it more challenging to look at operating expenditures. Without considering SBC, we think the business has reached economies of scale. During the Needham Growth Conference, Ms. Laube mentioned that the business didn’t add any headcount for the launches of Wells Fargo or the ongoing launch of US Bank, a testament to the team and infrastructure they have built (Note: they did add employees but none facilitate the new launches). With this backdrop in mind, we opted to look at the absolute level of operating expenses rather than as a percentage of revenue. Given the nature of the business, it should scale nicely with incremental ad dollars, which would drip down to increase operating margin over the medium term as the business model matures.
In our estimates, we have operating expenses (ex-SBC) continuing to decrease as a percent of revenue from ~53.0% in 2020, from 44.6% in 2019 to 37.6% by 2022 and to ~15% by 2030. With regards to SBC, we keep SBC as a percent of revenue higher than we would generally expect to account for the volatility in the numbers. All in, we have SBC expenses as a percent of revenue decreasing from 17% in 2020 (7.5% 2019, 17.8% 2018) to ~9.4% by 2022 and ~7.6% by 2030. All in, our estimates imply a ~25% GAAP operating margin by 2030.
To sanity check our numbers, we referenced Ms. Laube’s comments on the long-term model. In discussing the company’s long term operating model, Ms. Laube laid out targets of a $500M run rate on revenue with ~$100M reaching the bottom line by 2023. As the initial target for 2020 profitability was pushed back by COVID, we think there may some ground to catch up on with the expense side of the equation, but we see a similar path given top line growth numbers. We don’t see the business getting to this level until ~2024-2025 based on our estimates, with most of the delay being on the cost side of the equation.
Model Summary

Valuation
We value CDLX using a 10Y DCF model, applying a WACC of 8.7% to forecasted fundamentals through 2030, with strong growth estimates through the first half (~2025) and maturing growth over the back half of the model (2020). We apply a terminal EV/FCFF multiple to compensate for terminal year growth of ~8.5%. Applying a terminal EV/FCFF multiple of 24.8x, our model suggests an intrinsic value of $155 and implies EV/2021E Revenue of ~11.5x and P/Adj. Contribution of ~25.4x 2021E. The price target suggests a ~10% upside from spot prices.

Risks to the PT include:
COVID-19 remains a key risk to the thesis. CDLX has seen headwinds from weakness in advertising and consumer spending. Our base case involves a successful rollout of the vaccine and a normalization in trends by 2H21. In the case of a vaccine failure or a resurgence in the pandemic, we would reevaluate our top line assumptions over the medium term.
Operational execution – Growth of the CDLX business requires the successful monetization of the MAU base. This can be accomplished through increasing content engagement through more interactive advertising types and alternative incentives like non-bank advertising channels. Further, the rollout of the self-service platforms for ad agencies should reduce friction for both marketers and consumers. Any lapses in operating on these initiatives would cause us to reevaluate the thesis.
Data breaches – the data possessed by Cardlytics includes sensitive (although anonymized) purchase data on millions of consumers around the globe. A data breach would impact the businesses credibility and may impact user engagement through banking channels. While we see this as more of a tail risk, it could pose significant damage to the company.
Cyclicality – While the business has undergone a change in perspective with regard to their advertisers they work with (from more cyclical end markets like travel and leisure to the addition of e-commerce and DTC businesses), we have seen the impacts that consumer spending can have on the business. With that in mind, the economic cycle and changes in consumer spending will pose a risk to the business. While we do think the business has made strong moves to diversify their marketing exposure, this remains a key risk as any adverse move in consumer spending or employment may impact consumer spending and with it, advertising spend.
Competition – While we do believe the Cardlytics platform has a significant “first mover” advantage that has afforded them an attractive moat, they are competing in one of the most competitive industries, advertising. In the case a bank was to try to replicate this business (we discussed why this is unlikely above), this could pose a risk to the CDLX platform. Similarly, if a non-bank or other FinTech were to try to compete, Cardlytics may have to raise incentives or FI shares to navigate new entrants. Again, we think this is unlikely given the high regulatory burdens and Cardlytics agreements with many of the largest banks in the country.
Analyst Coverage History
Note we have covered CDLX since March 2020. The below graphic illustrates our coverage history on the company.

Disclaimer & Disclosure: We do own a long position in CDLX. This information is for research purposes only and is not investment advice. Please do your own research prior to any investment decision. Past performance is not indicative of future results.
If you enjoyed this post, please share & subscribe for more updates.