

RH: Bear Case for Bull Outcome?
RH: Bear Case for Bull Outcome?
Assuming Anemic Growth Over the Next Decade, RH Can Still Deliver a 14% IRR Over 5 Years

NOTE: The model referenced throughout this note is available, please reach out to me via email or Twitter DM.
Background: The stock has meaningfully lagged YTD given obvious macro concerns and its inherent “high beta” (luxury, discretionary, reliant on new home purchases, especially at the highest level). The company has been overearning during the pandemic as the high wealth demographic was purchasing or refurnishing their homes as they spent more time there. Meanwhile, the company is heavily investing in several of its “newness” initiatives, including RH Modern, RH Guesthouse, and several other “hospitality” and “destination” experiences. All said, the stock is down ~55% YTD, though Gary Friedman, a unique CEO with sizeable ownership (12% per TIKR data) and a big vision, recently raised the company’s cash (for meaningful excess cash relative to market cap). To that end, the company also has a history of buying back stock in quick bursts, especially during times when the stock is especially out of favor. That said, assuming a 1) a near full reversion to pre-COVID trends, 2) very modest growth/margin assumptions, 3) modeling for the investment year capex in 2022-2023, and 4) considering a buyback in 2022 given the excess cash load, RH could offer a ~14% 5-year IRR assuming near no growth at current valuations.
Business Model & Segments:
RH, fairly popular throughout Twitter, is a luxury home furnishing company quickly evolving into a luxury brand as it “climbs the luxury mountain”. The company has been undergoing a footprint rationalization for the better part of a decade, as it rebrands away from its legacy Restoration Hardware brand. Recent initiatives include hospitality (RH Guesthouse), private jets (RH1, RH2), yachts (RH3). For its core business, RH sells luxury home furnishing, including bath/kitchen with its Waterworks brand, of which it acquired in 2016. It’s worth noting that Waterworks only contributes ~5% to total top-line, so I’ll focus largely on the core RH business for the majority of the write up, with consolidated numbers at the end for valuation purposes.
The core RH business is ~70% furniture and ~30% non-furniture (lighting, textiles, décor etc.), and though they stopped reporting DTC sales, its worth noting that in 2018, DTC accounted for ~44% of top-line, though for the sake of comparison purposes, I’ll run total core RH sales per sellable sqft. given the lack of DTC disclosure (trying to avoid assumptions on assumptions).
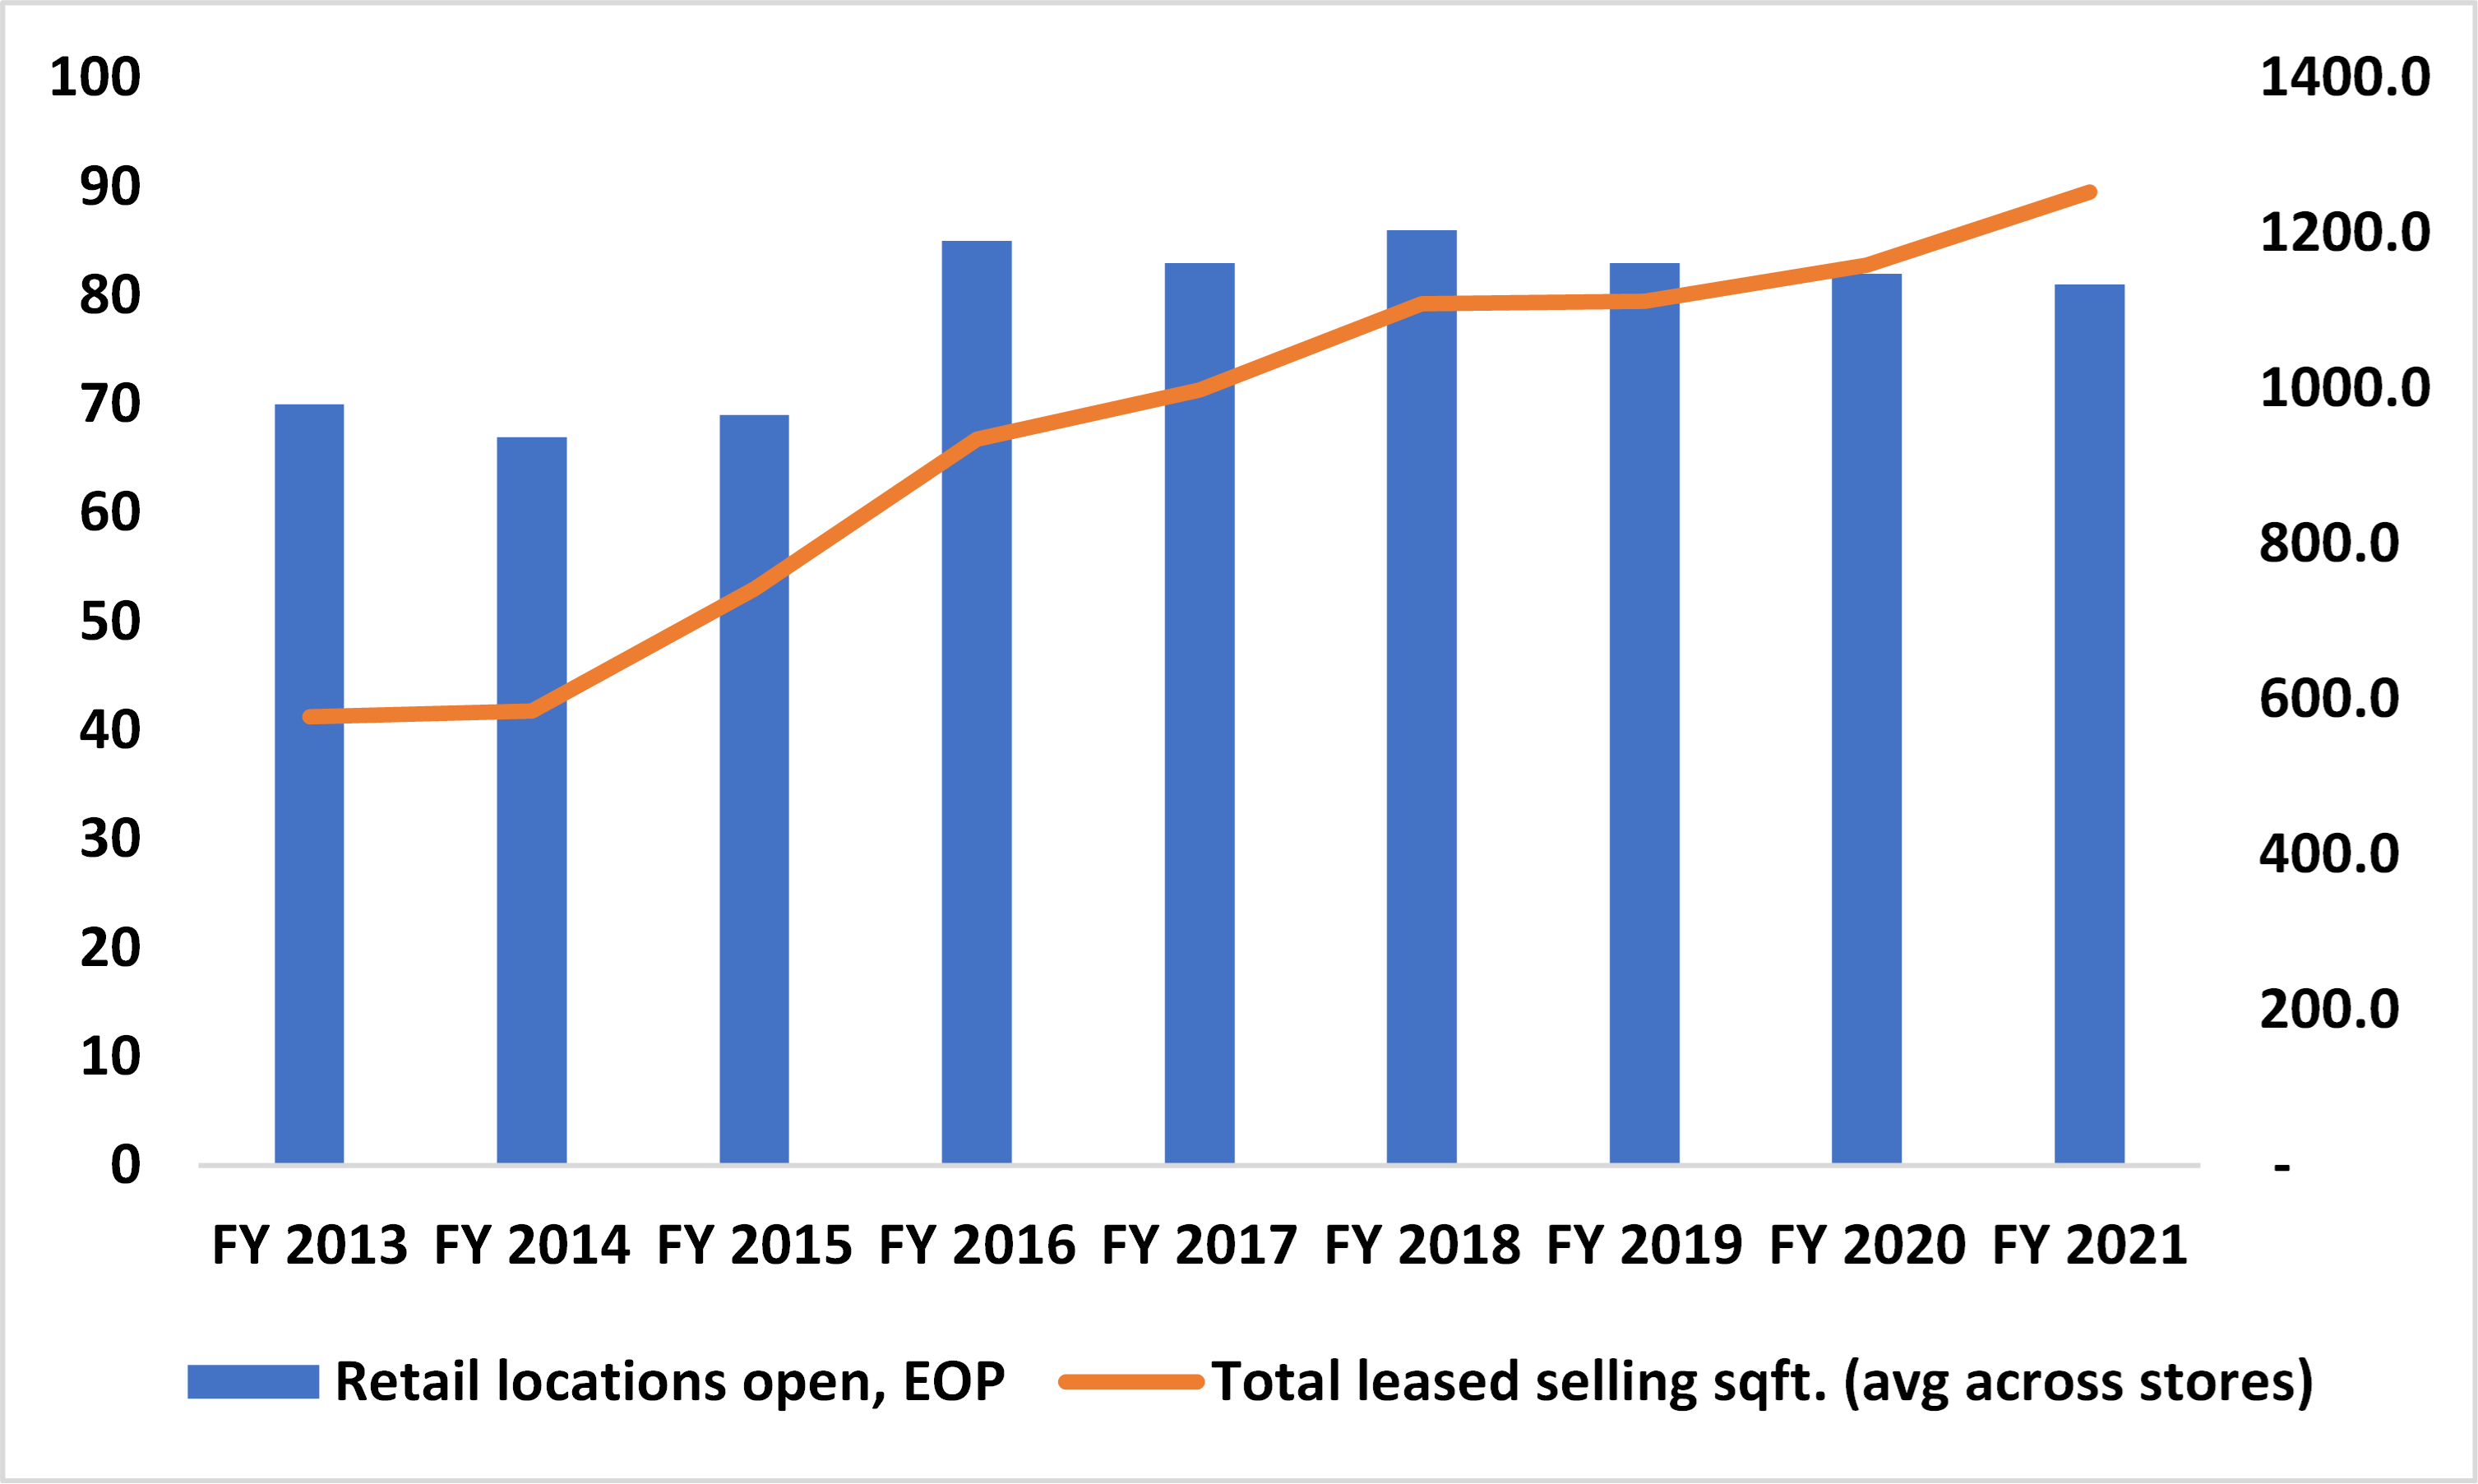
Real Estate Footprint. The core RH footprint includes 67 retail locations (36 legacy galleries, 27 design galleries, 3 RH Baby & Child, and 1 RH Modern), with an additional 39 outlet stores as of 1Q22. Including the 14 Waterworks locations, it’s a total 81 locations with an average leased sellable sqft. of ~1,253 (~1,196 core RH). The average outlet store has ~1,190 total leased sqft. (assuming a similar ratio as total RH, its fair to assume sellable sqft of ~70% of total – given storage, back office, etc).
Given the nature of the opportunity, I wont go too deep into the growth opportunities, and will instead punish RH for the capex, but keep core RH growth steady and assume no mix shift in stores, leaving that for another day…
Given some changing disclosures through the years, I’ll briefly explain how I come to core RH revenue (recall, the company used to disclose store vs. DTC revenue). Within the RH Segment (everything ex. Waterworks), I break out Outlet stores (different economics), membership fees (100% margin, linear), and get an implied core RH (store and DTC revenue). For the purpose of simplicity, I assume sellable sqft. generate all sales, which may or may not have some merit, though historical trend is consistent, giving some confidence (fair rule of thumb is ~40% DTC revenue).

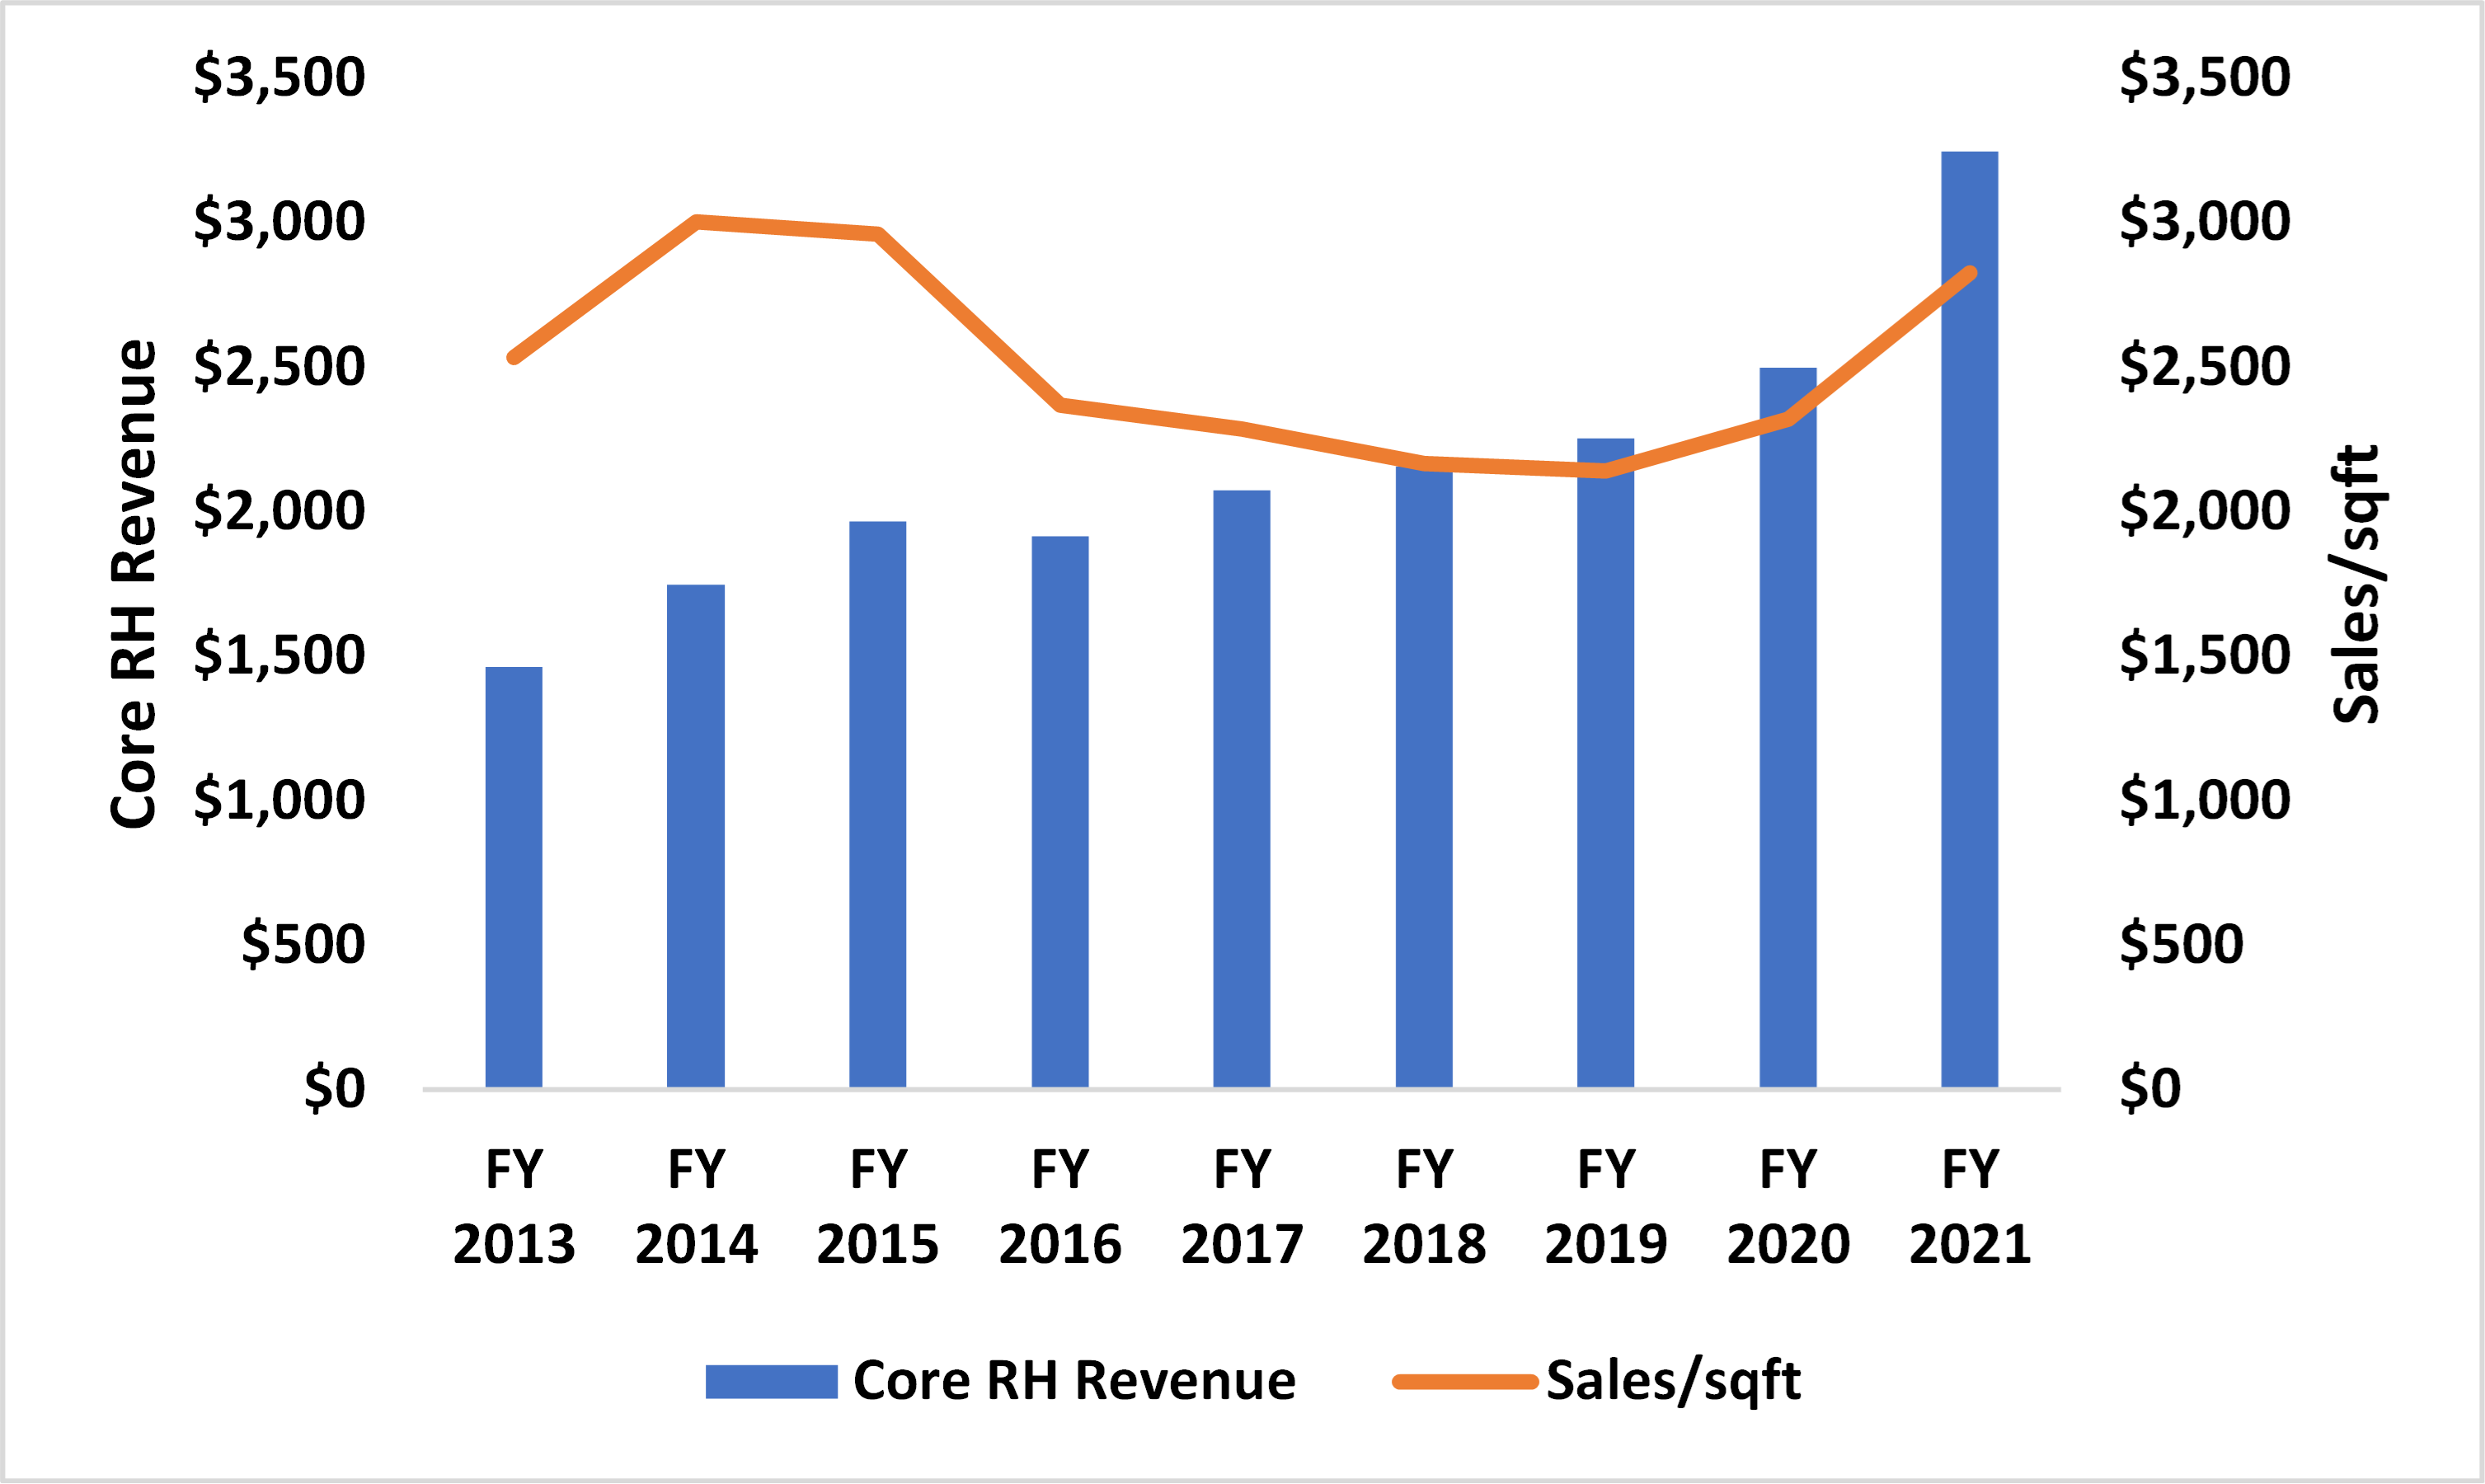
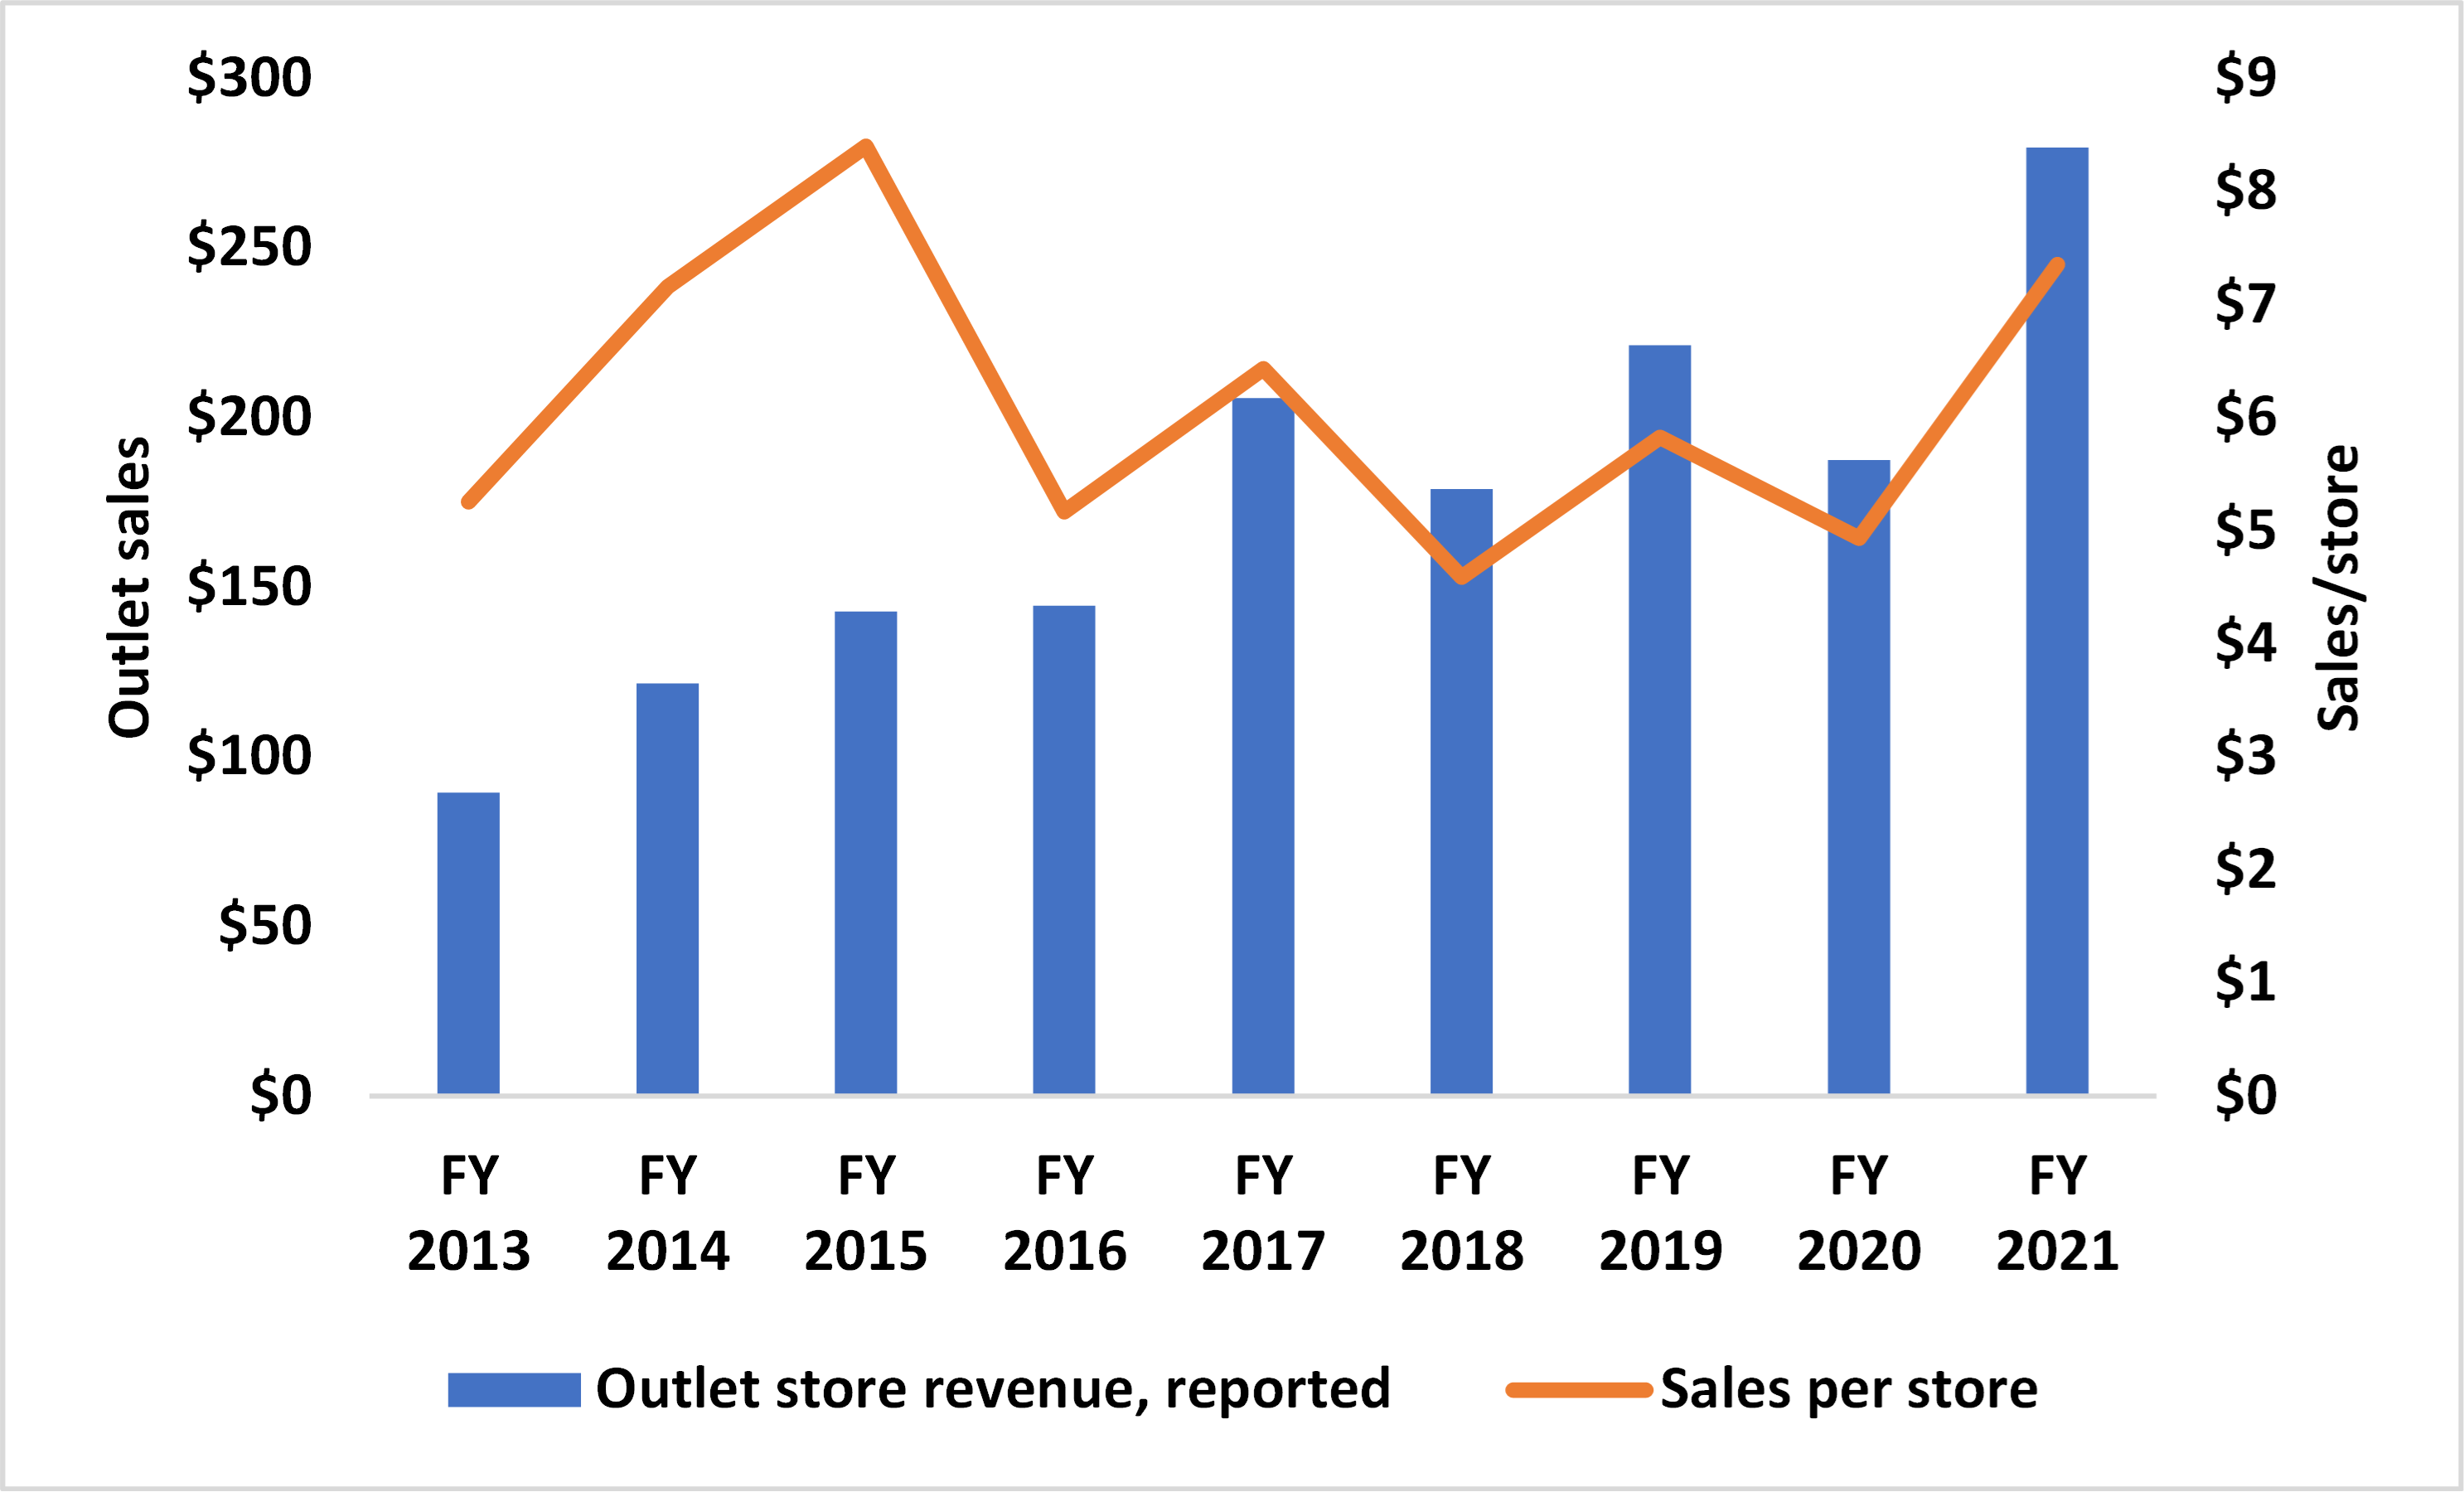
Core RH. As you can see in the above, RH greatly benefitted from the “X from home” era, as it is seemingly over earning, as that trend does come thru in the sales/sqft. data, as it saw sales/sqft. of ~$2,800 (vs. prev. cycle high ~$3,000 in 2014), +22% y/y. Similarly, Outlet sales were overearning as well, with +49% y/y top-line in 2021.
The membership segment is a bit newer, launched in 2016, and with ~460 members today. This is a huge value to consumers (25% off purchases for $175/year which, considering the price of RH goods, pays for itself in just a visit). For RH, this is nearly pure margin which, priced at $175/year, is a ~$80MM contributor today (and growing modestly).
Waterworks. The waterworks business saw similar action to RH in 2021, seeing sales/sellable sqft. jumping to ~$2,900 vs. 3Yr avg. ~$2,200, with revenue +38% y/y.
All said, on a NOPAT basis (and including Waterworks), the company has been able to grow its NOPAT/sellable sqft. at a ~27% CAGR since 2013, largely a testament to the rationalization of the real estate footprint and the pivot toward the higher of the high end consumer, for higher AOVs and the increased propensity to opt-in for in-house design.
Model. All said, this was done during the initial build out as I was starting to sharpen my pencil on RH a bit more. Here I was really trying to see what I had to believe to get constructive on a luxury retail player in the face of a challenging (certainly the most challenging in my short career) macro environment.
That said, here is a quick overview of the operating assumptions in the model (open to share, please send me an email or DM on Twitter):
Revenue
· RE Footprint: No store growth at all, thus no change in average sellable sqft.
· Sales/sqft: Reversion toward 2019-2020 levels in 2022-2023 and then modest 2% y/y growth thereafter.
· Outlet sales per store stay constant at $6MM per store
· Membership +10K subs per year at $175/year (latest price)
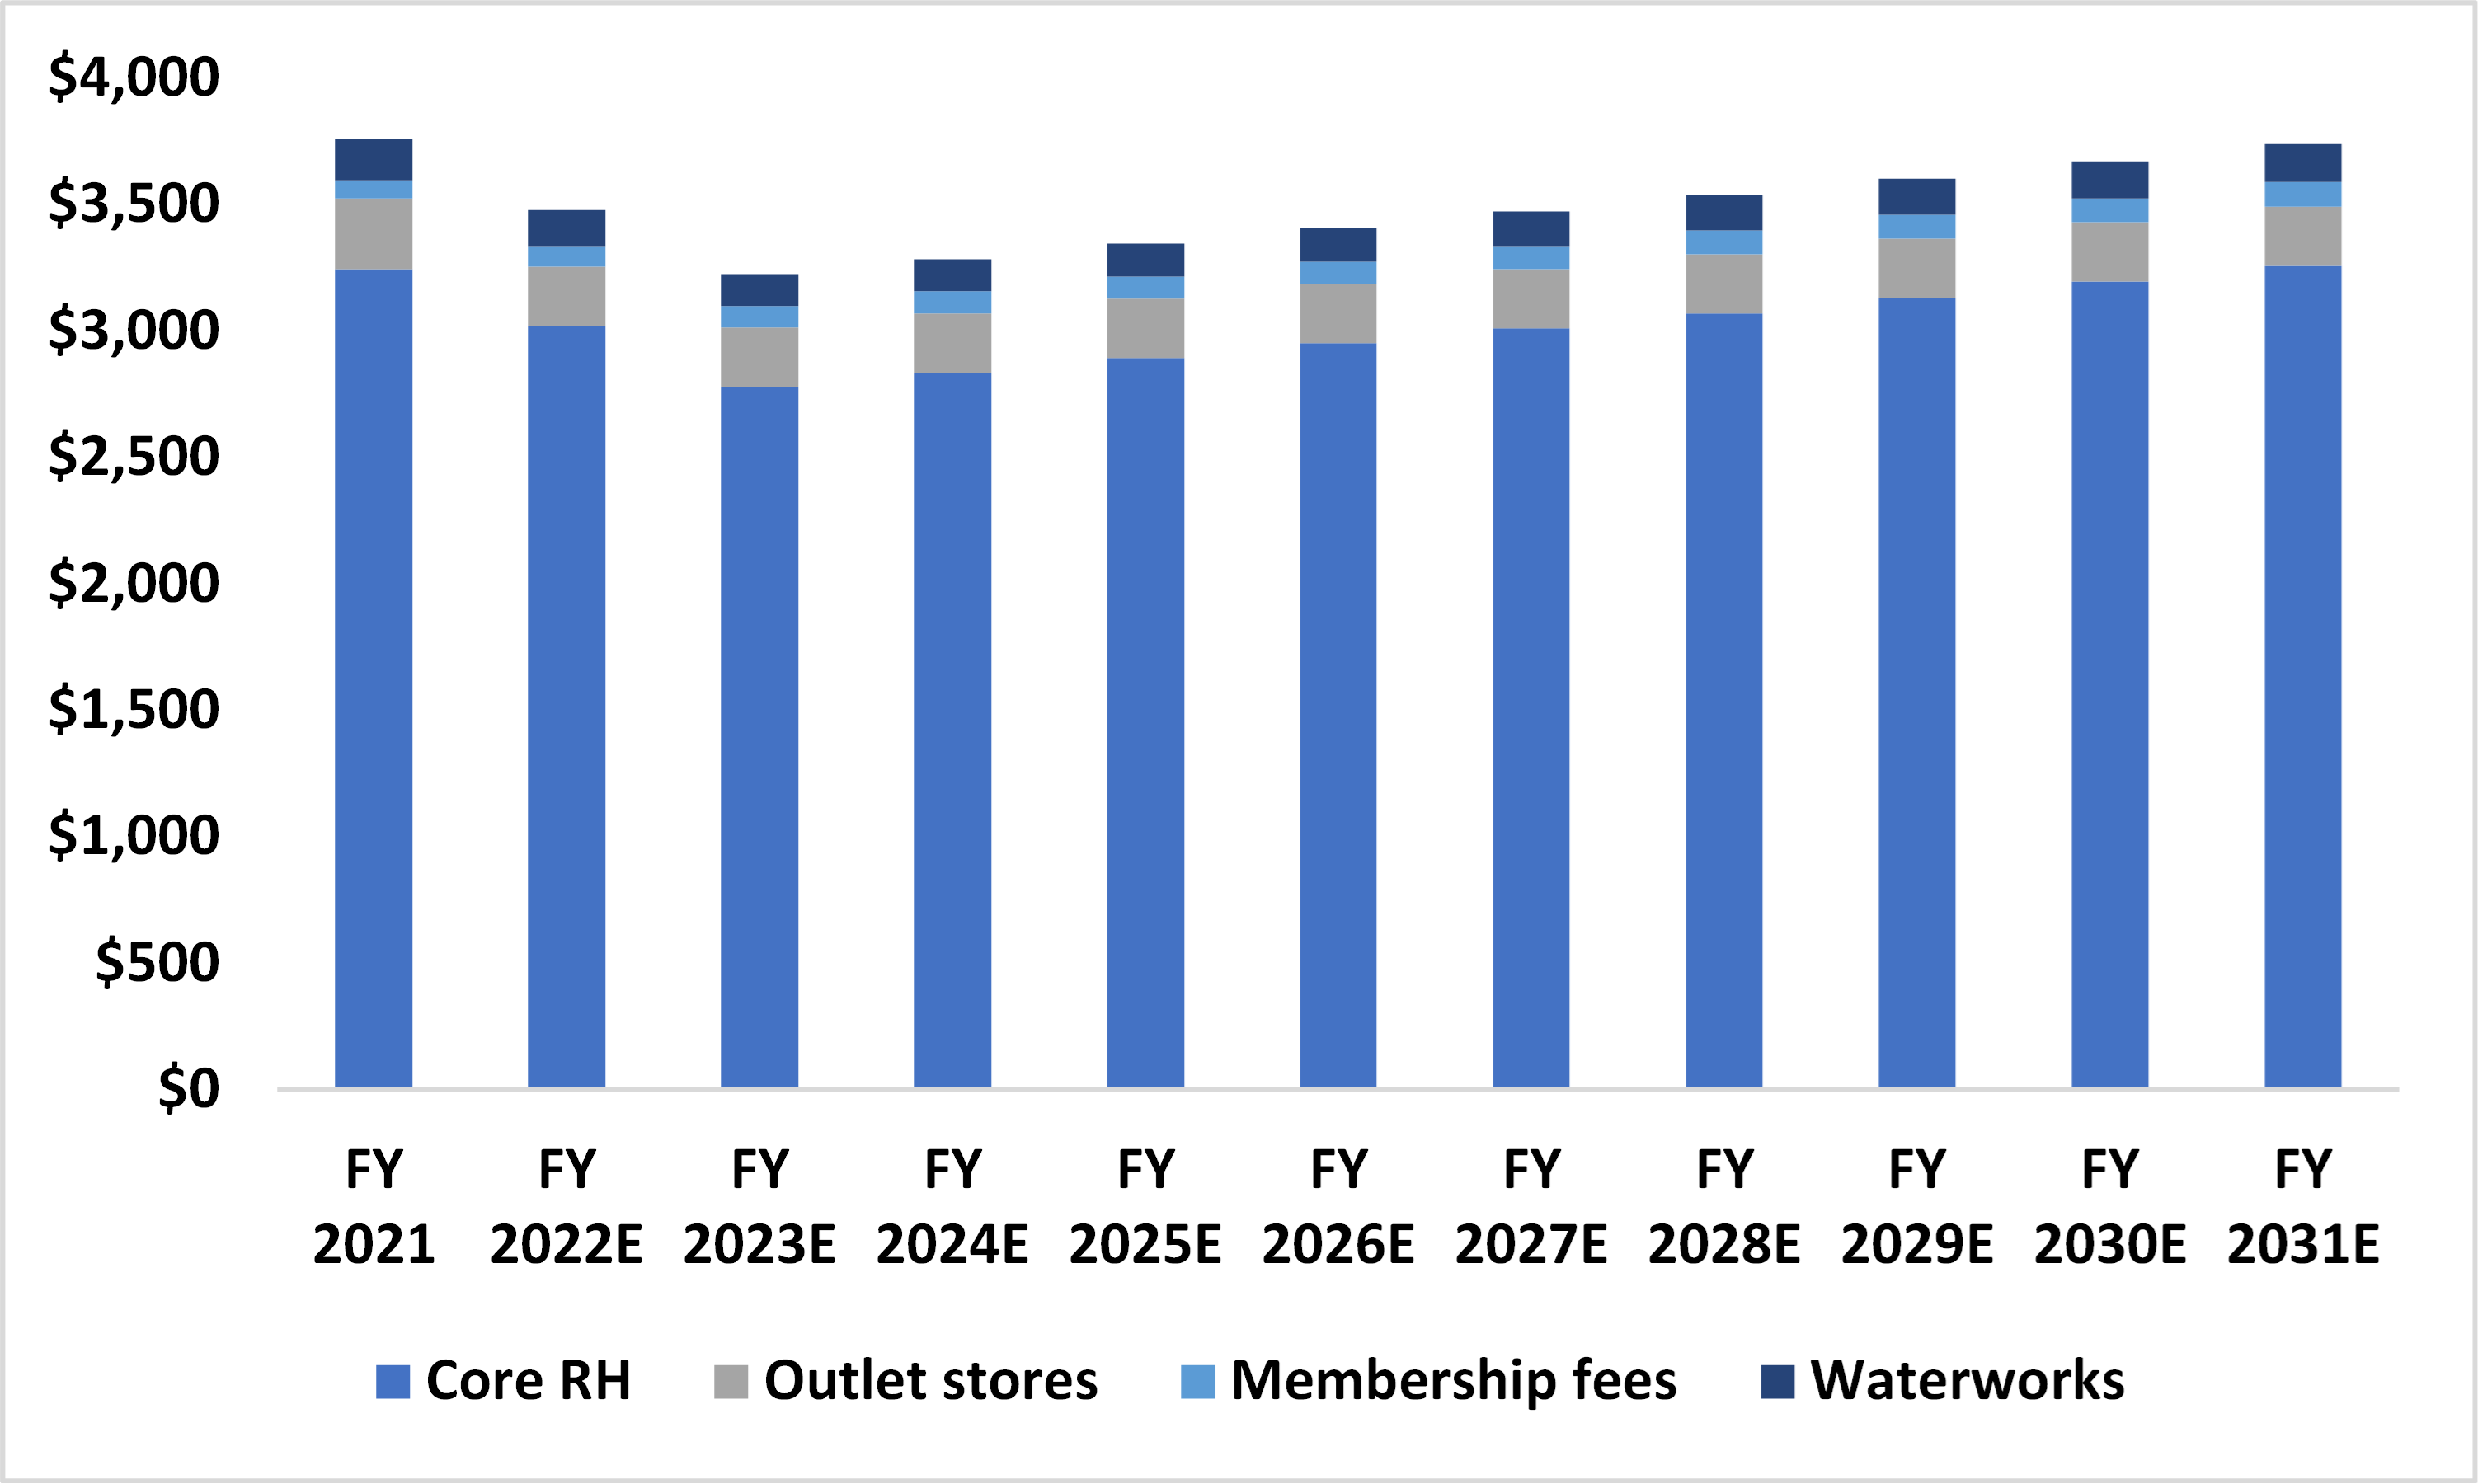
With these assumptions in place, the revenue growth and mix looks like the following (a CAGR of essentially zero):\
Margins
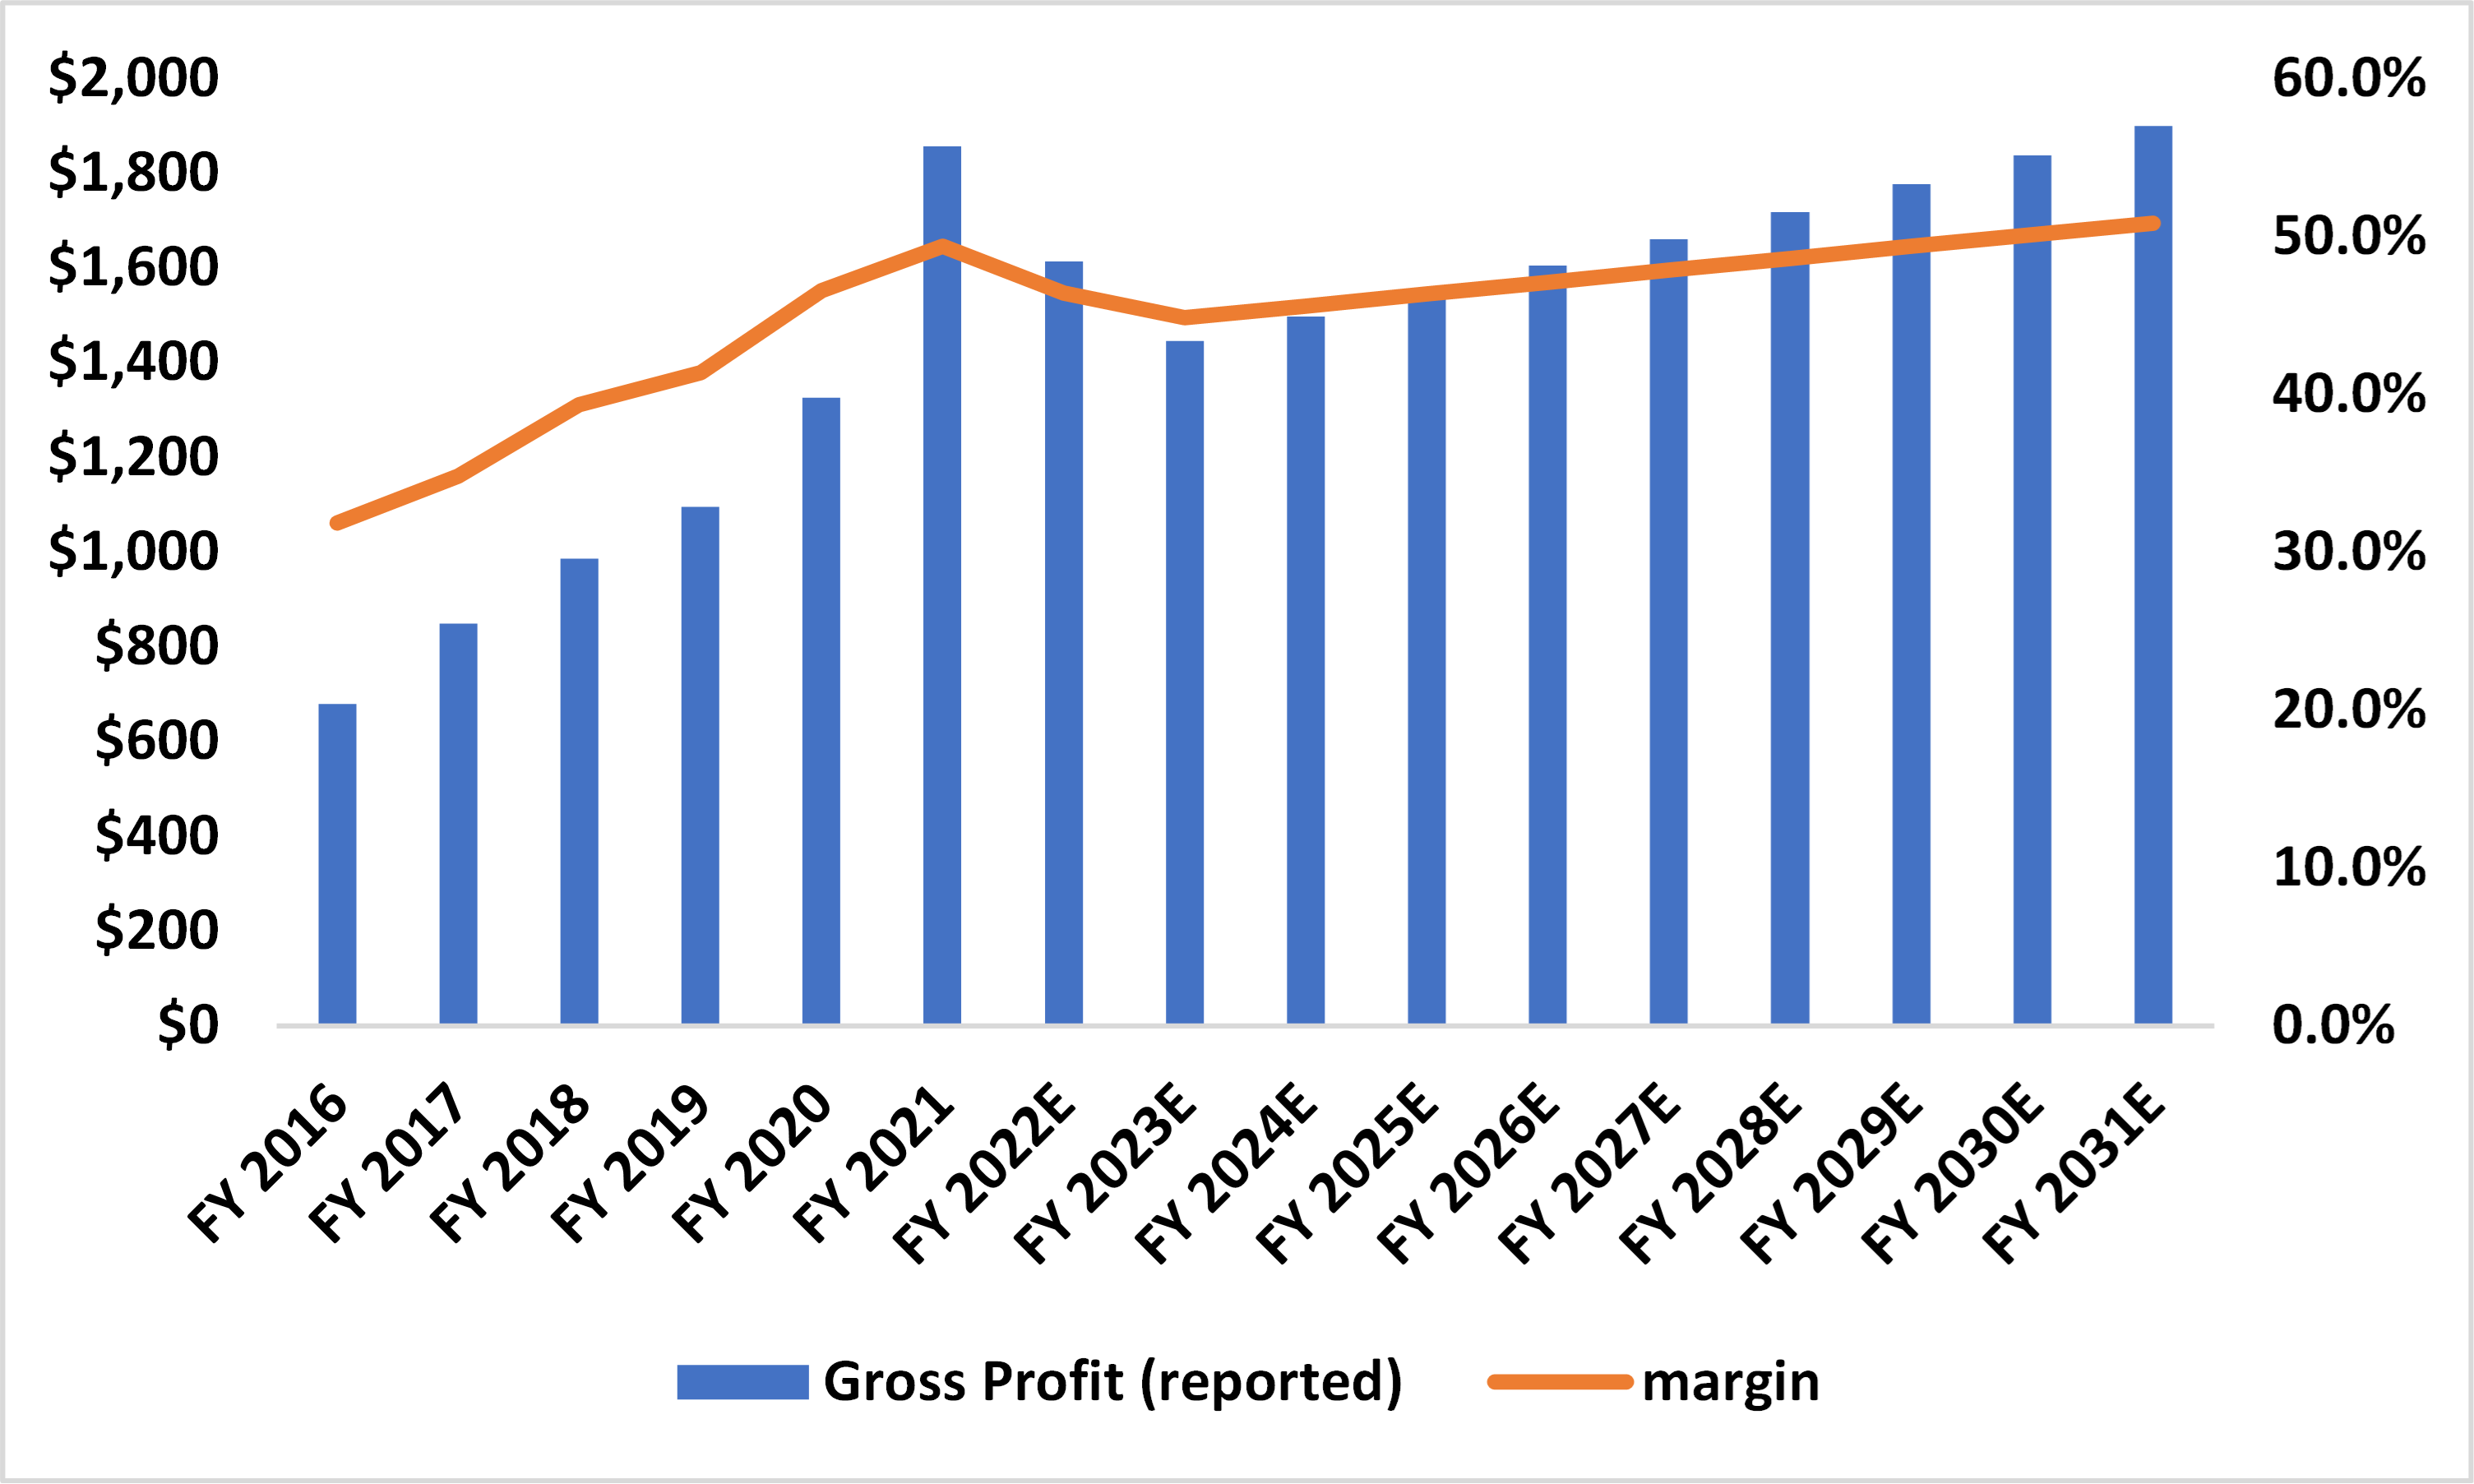
Keeping it simple on margins, I docked margins in 2022-2023 back to pre-COVID earning levels, and assumed modest growth of +75 bps/year for both Waterworks and RH. End state margins of ~51% vs. 49.4%. See below chart (consolidated metrics).
NOPAT, Capex
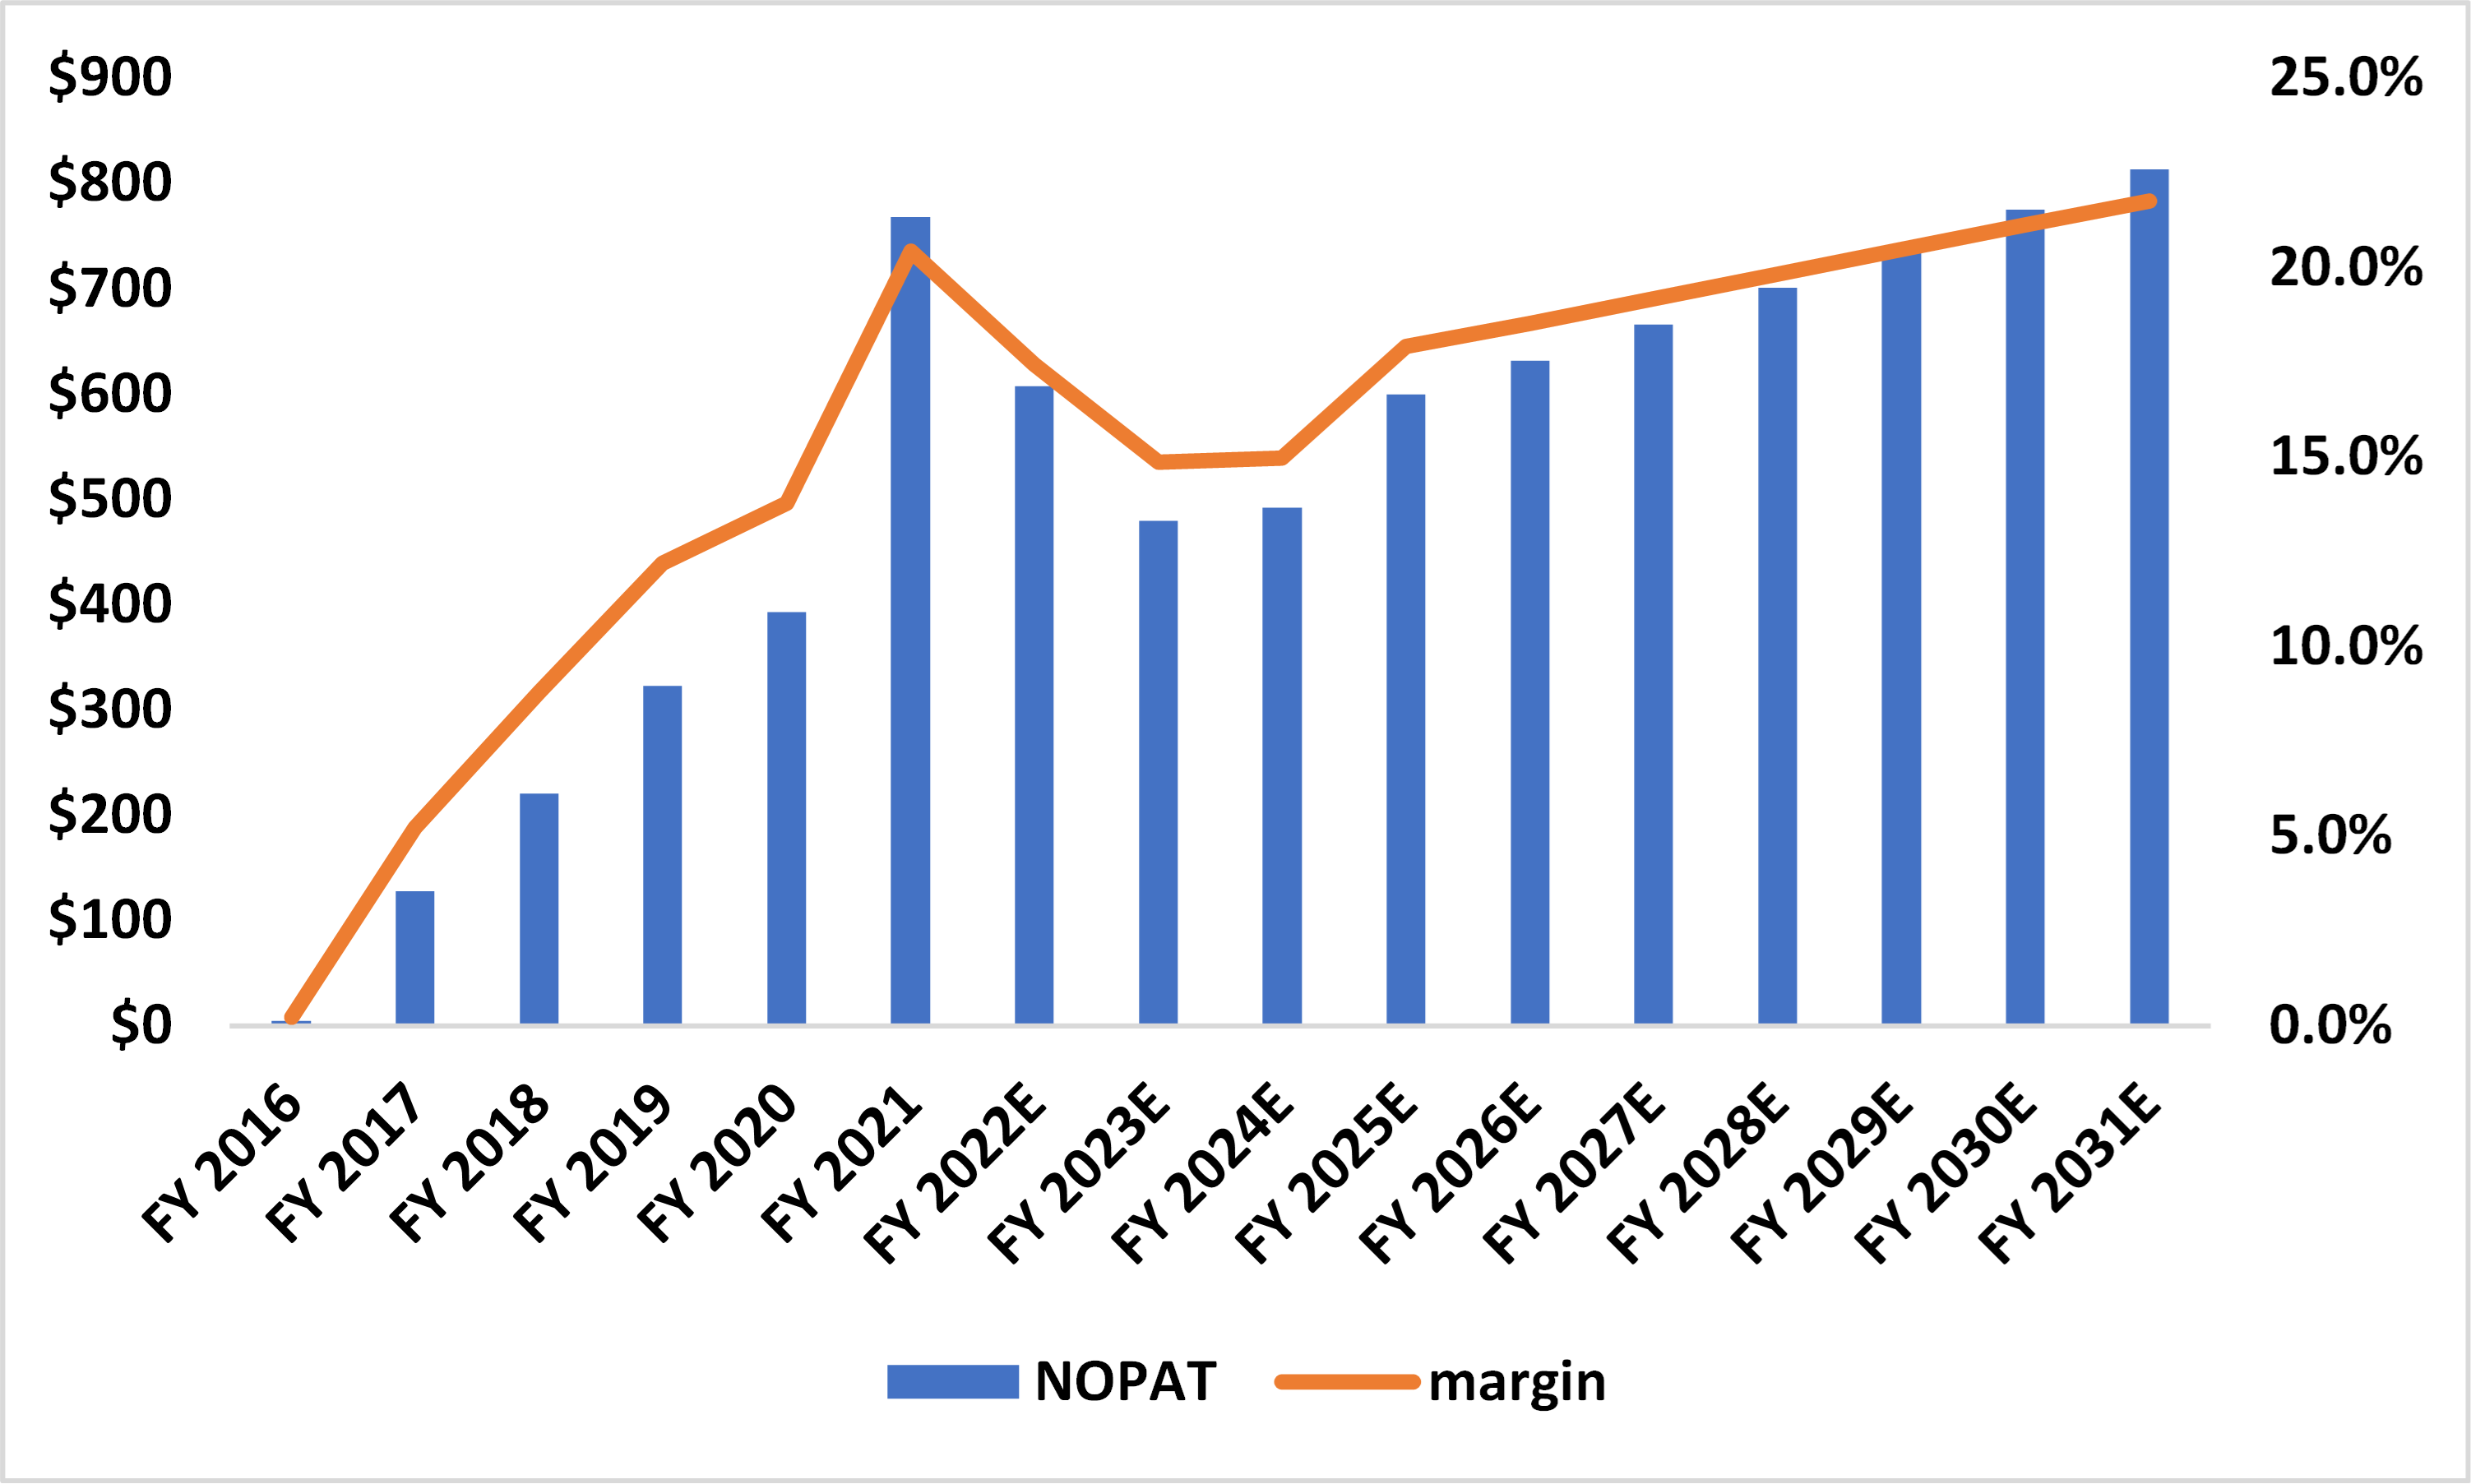
With these assumptions, the model assumes a steep drop in the over-earnings NOPAT margin, from ~20% in 2021 o a trough of ~14.9% in 2023, with a linear but modest improvement thru terminal year. Worth noting in this model, RH doesn’t achieve its 2021 NOPAT until 2030E in $ terms.
On capex, while I give no credit for new store growth and the associated income, especially considering the pivot to higher ticket sales and more luxury etc., I will consider the capex costs of the expansion initiatives. Specifically, I assume Gross Capex (admittedly an estimate, considering a few line items given changing disclosures; again feel free to reach out for the model, I am trying to learn) peaking in 2023 though remaining elevated. when in 2027+ I assumed "steady state” metrics.

Valuation
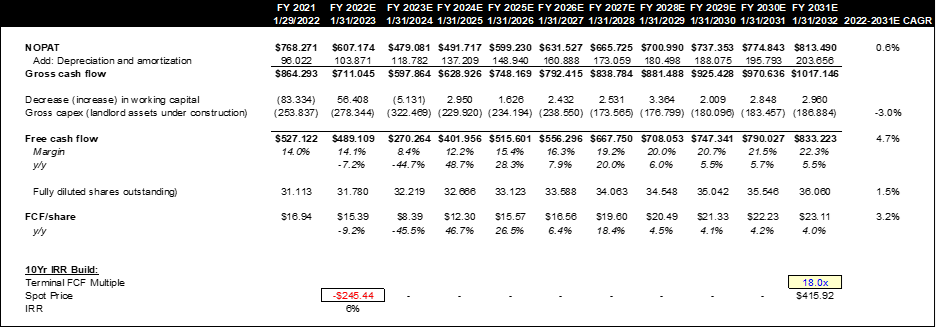
As the model shakes out, I assume a FCF CAGR of 4.7% thru 2031 (a terminal margin of ~22% and growing ~5.5% y/y). Assuming modest 1.5% CAGR share dilution per annum, the base (though arguably bear) model spits out a FCF/share CAGR of ~3.2%. Applying a conservative 15x multiple on 2026E FCF/share breaks even at Friday (6/17) close. Worth noting applying a 18x yields a ~5% CAGR.

On the 10Yr numbers, we would have to apply an 11x FCF multiple to breakeven (18x gets 6% IRR).
Where could the buyback go?
RH, specifically Mr. Friedman, has a history of being opportunistic with the buyback, in 2017 purchasing ~50% of shares (at ~$51.09 for the record). To that end, in 2021, the company increased its term loan, and later, in June 2022, increased its buyback authorization by ~$2B, now with ~$2.45B available.
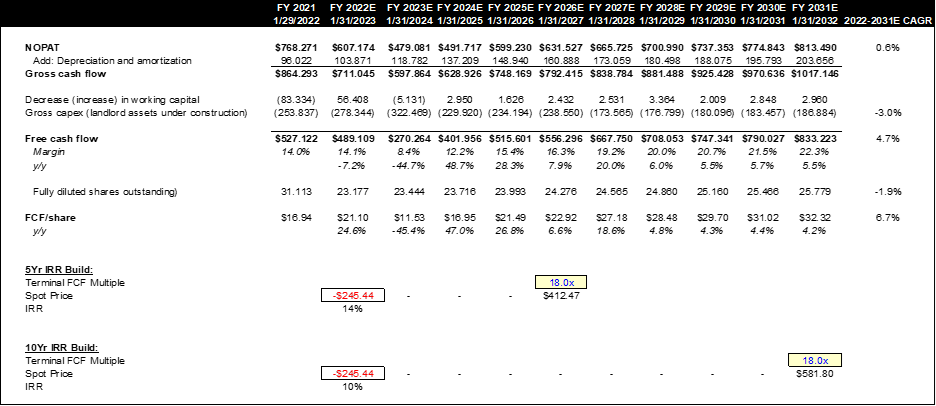
For the purpose of calculating NOPAT (specifically in NWC), I try to back out excess cash (based on looking at historical minimum cash levels, which in this case I assume to be $100MM (~3% sales). With 2022E excess cash before assuming any buyback, there is ~$2.6B excess cash. RH could potentially buyback 40% of its shares outstanding, spending ~$2.1B (assuming 6/17 close), and assuming the same 18x terminal multiples, the 5Yr and 10Yr IRRs are 14% and 10% respectively. This also increases our FCF/share CAGR to 6.7% vs. 3.2%.
Conclusion. RH stock, a best-in-breed in the luxury home furnishing space is being priced for essentially no growth over the next decade, meanwhile the company is being penalized for its heightened capex envelope over the coming years. Assuming a near full reversion to pre-COVID levels and conservative growth assumptions thereafter, we would have to apply a 15x multiple on 2026 FCF with no buyback to breakeven from 6/17 close. Further, with the authorization having been raised in June, there’s a good probability for an outsized buyback which, paired with the same low growth assumptions, could yield a 14% 5-year CAGR and 10% 10-year CAGR. Meanwhile, amid a challenging macro, I do find some level of solace in RHs focus on the high-end consumer, with ample pricing power and what should be a more agnostic consume when it comes to spend. That said, in this model, any upside to operations is purely gravy, as I only consider a bare bones RH.
NOTE: I hope this was useful to someone. I have been away from the FinTwit sphere and with it, this blog for over a year now. I do look to continue posting more content (hopeful more thoughtful, longer-form content) in the near future. Until then, notes will more likely be along these lines. I am posting more with the goal of seeking to learn and gain differing perspectives. That said, my line is always open, please drop me an email at contact@bigwaveresearch.com or follow me on Twitter @BigWaveResearch.